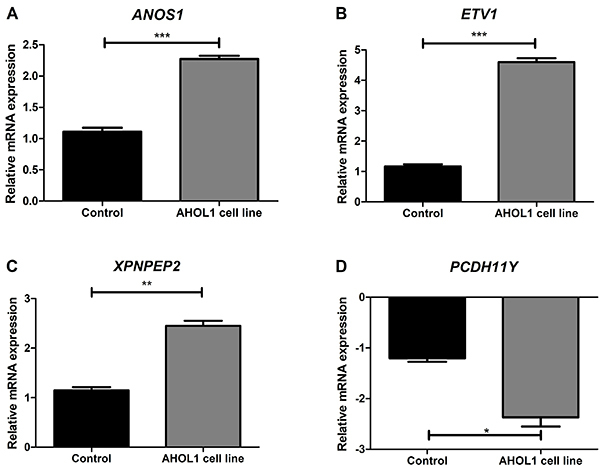
Figure 7. Validation of the microarray data by qRT-PCR. qRT-PCR was performed for ANOS1 (A), ETV1 (B), XPNPEP2 (C), and PCDH11Y (D) genes. Data are reported as fold change in mRNA expression and compared with a tissue fragment from normal brain as a control. Each bar represents means±SD values for each gene with three technical replicates. Statistical significance was determined using Student's t-test: *P<0.05; **P<0.01; ***P<0.001.

