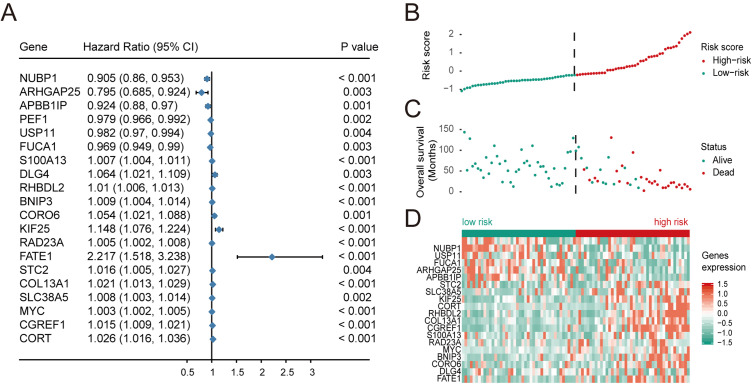
Figure 2. Multivariate Cox regression analysis was performed for the selected genes, and the risk scores, survival status and risk heat maps of the 20 prognostic genes were distributed in the training set.
(A) Hazard ratio distribution for selected 20 key genes.distribution of risk scores, (B) overall survival of 84 patients, and heatmap of 20 genes in prognostic classifier in the training set. The black dotted line suggested the median cutoff divividing patients into low-risk and high-risk groups.

