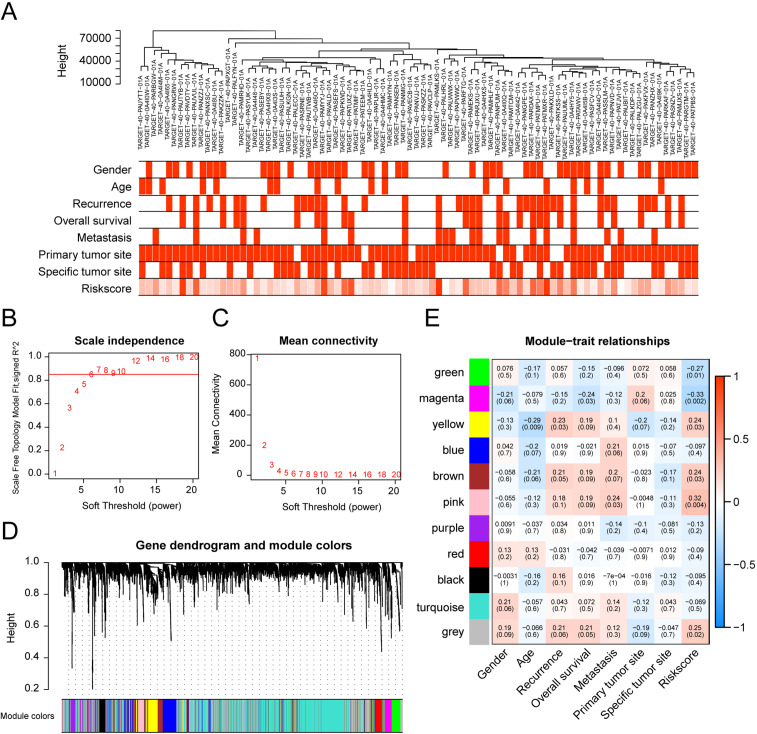
Figure 6. Overview of co-expression modules identified from the osteosarcoma RNA-seq dataset based on the training set.
(A) Sample dendrogram and trait heat map underlying gene expression data and clinical information.(B) Scale independence and (C) average network connectivity with different soft threshold powers (). Select a soft threshold power of 7 to achieve maximum model fit. (D) Cluster dendrogram of the co-expression modules of the 20 genes identified. Each differentially expressed gene represents a leaf, and each of the six modules consists of a branch. The lower panel displays the colors assigned to each module. Note that the gray blocks indicate unassigned genes.(E) Weighted correlation of module features between the identified modules and clinical features and corresponding P-values. The color scale on the right represents the correlation of module features from -1 (blue) to 1 (red). Green represents perfect negative correlation, and red represents perfect positive correlation.

