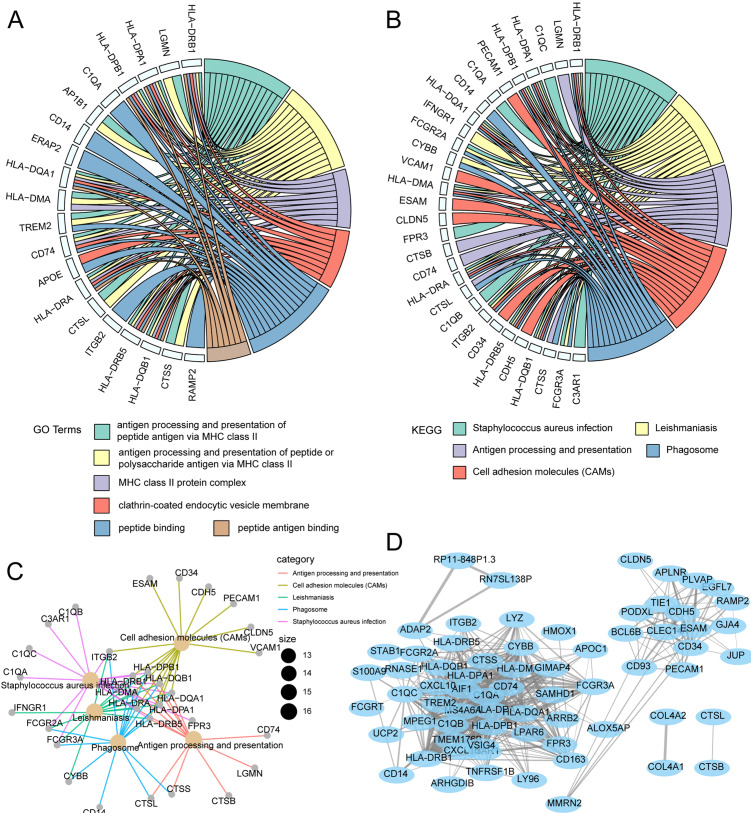
Figure 7. Functional enrichment analysis and WGCNA weighted network analysis of magenta module.
(A) GOplot indicated the correlation between magenta module genes and their related GO terms. (B) GOplot indicated the correlation between magenta module genes and their related KEGG terms. (C) KEGG pathway analysis of magenta module genes based on clusterprofiler. (D) WGCNA weighted network diagram of magenta module.

