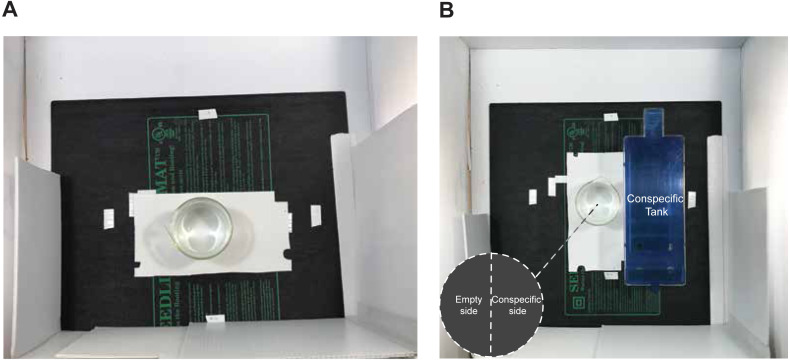
Figure 2. Experimental set up for tracking behaviour during dosing.
(A) Isolated dosing, or (B) In-view dosing. The circle in the bottom left of figure (B) represents the virtual zones created in Ethovision to test whether fish spend more time on the side of the beaker closest to conspecifics when in view.

