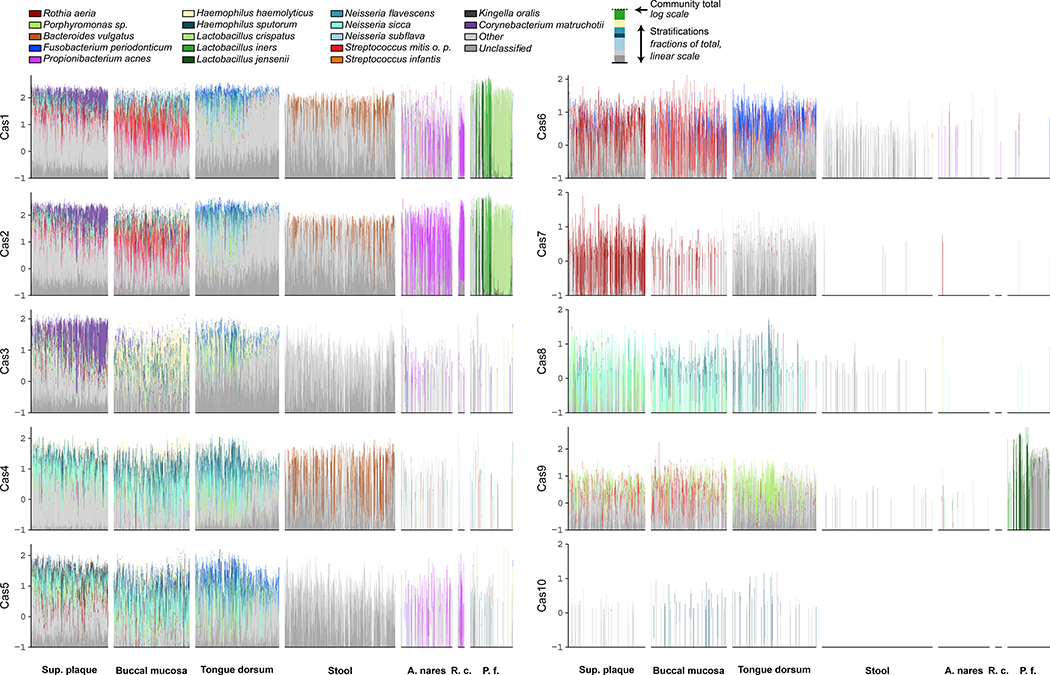
Figure 5: Difference and similarities of cas gene abundances across body sites stratified by contributing species.
The height of each set of stacked bars (y axis) indicates the total cas abundance within a single sample, normalised for gene length and sequencing depth on a log10 scale. The taxonomic stratifications are done using a linear linearly (proportionally) scale. Species, “other,” and “unclassified” stratifications are linearly (proportionally) scaled within the total bar height. Highlighted taxa account for at least 35% of overall species abundance for each cas gene. Order of samples (bars) is according to the global Bray Curtis dissimilarity of the full microbiota within the body areas. Body areas with less than 30 samples are not shown. The y axis scale can be negative to facilitate the visualization of small abundances.

