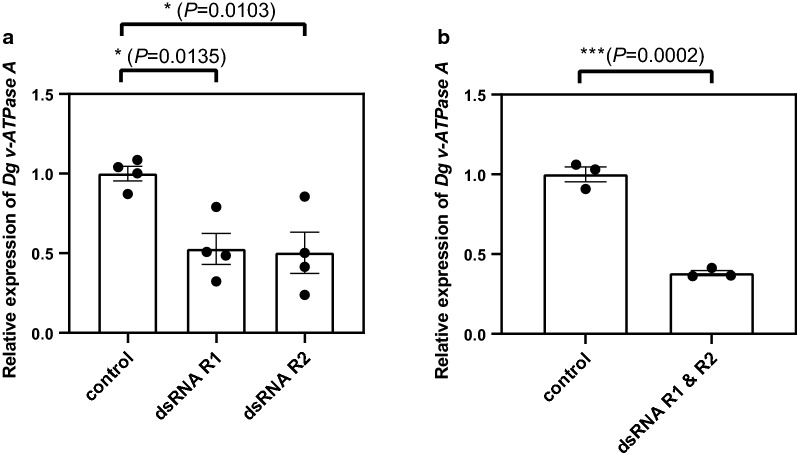
Fig. 4.
RNAi gene knockdown of Dg vATPase A in D. gallinae. Quantitative PCR gene expression analysis of Dg vATPase A expression in adult female D. gallinae mites fed on goose blood containing lacZ dsRNA (control) or Dg vATPase A dsRNA from R1 or R2. R1 and R2 Dg vATPase A dsRNAs were either added separately (a) or combined (b) in goose blood at a final concentration of 100 ng/μl, with the experiment shown in b containing equimolar amounts of R1 and R2 dsRNA. Dg vATPase A expression is shown at 96 h post-feed and is normalised to glyceraldehyde 3-phosphate dehydrogenase expression. Individual data points for biological replicates are shown with mean ± standard error of the mean (SEM) (n = 3–4). Asterisks represent significant difference at P < 0.05 between treatments determined by a one-way ANOVA with Dunnett’s multiple comparison test (a) or Student's t-test (b)

