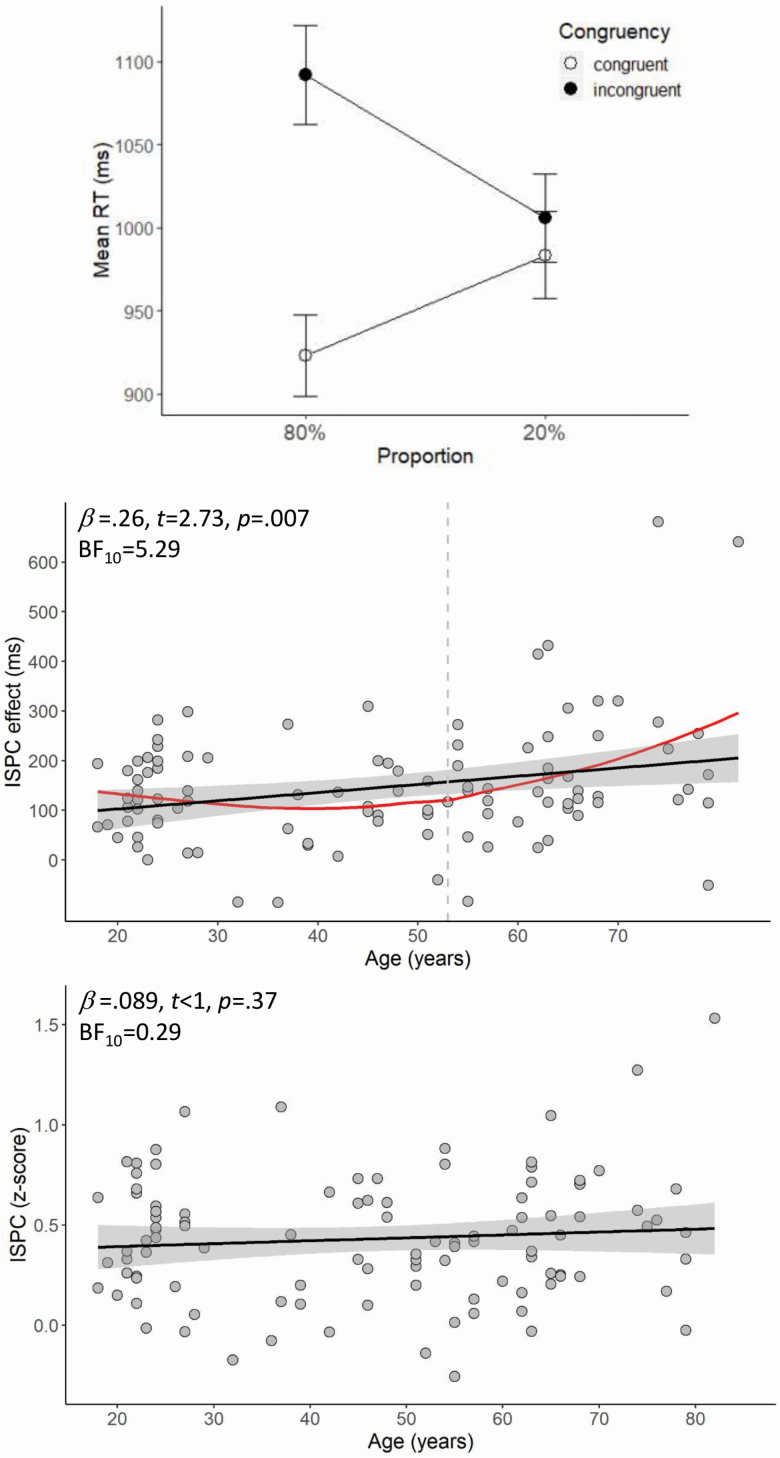
Figure 3.
Top panel: Mean RT (ms) for congruent and incongruent trials as a function of proportion congruency. Center and bottom panels: The black line in the scatterplots illustrates the relationship between age and the item-specific proportion congruency (ISPC) effect as reflected in RTs (center) and z-scores (bottom). The red line shows the LOESS smoothed age trajectory; the dashed line indicates the age at which changes started (color figure online).

