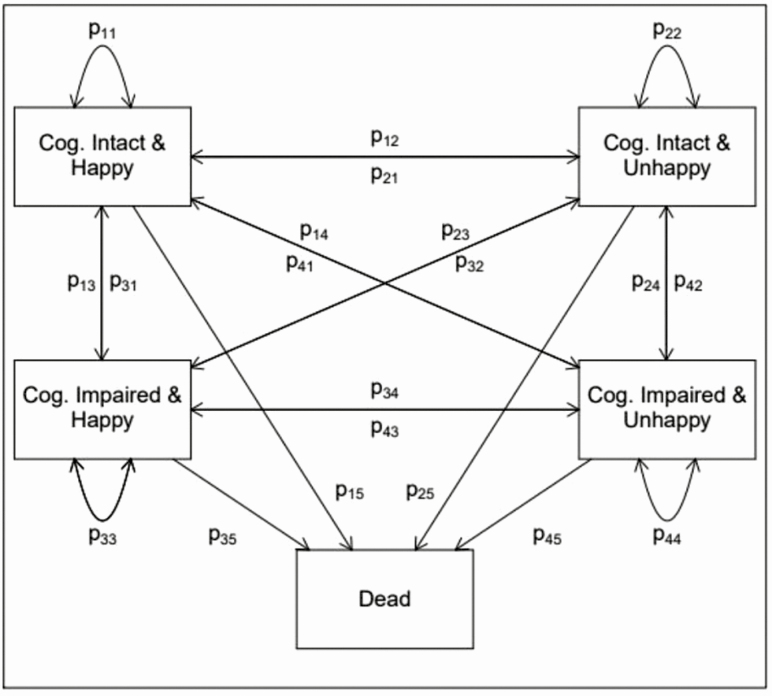
Figure 1.
State space used in multistate life table modeling. Transition probabilities, p, shown between (1) happy and cognitively intact, (2) happy and cognitively impaired, (3) unhappy and intact, (4) unhappy and impaired, and (5) dead states. The general state space is the same across all ages, although the transition probabilities are modeled as a function of age and covariates.

