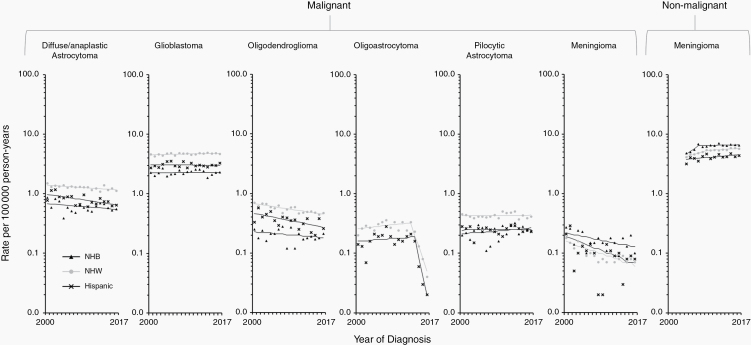
Figure 2.
Trends in age-standardized incidence rates for selected malignant (2000–2017) and nonmalignant (2004–2017) brain and other CNS tumors in the SEER 21 registries, by race/ethnicity—Men. Symbols represent observed data; lines represent modeled data. The rates are plotted on the log scale. NHW, non-Hispanic white; NHB, non-Hispanic Black.

