Figure 6.
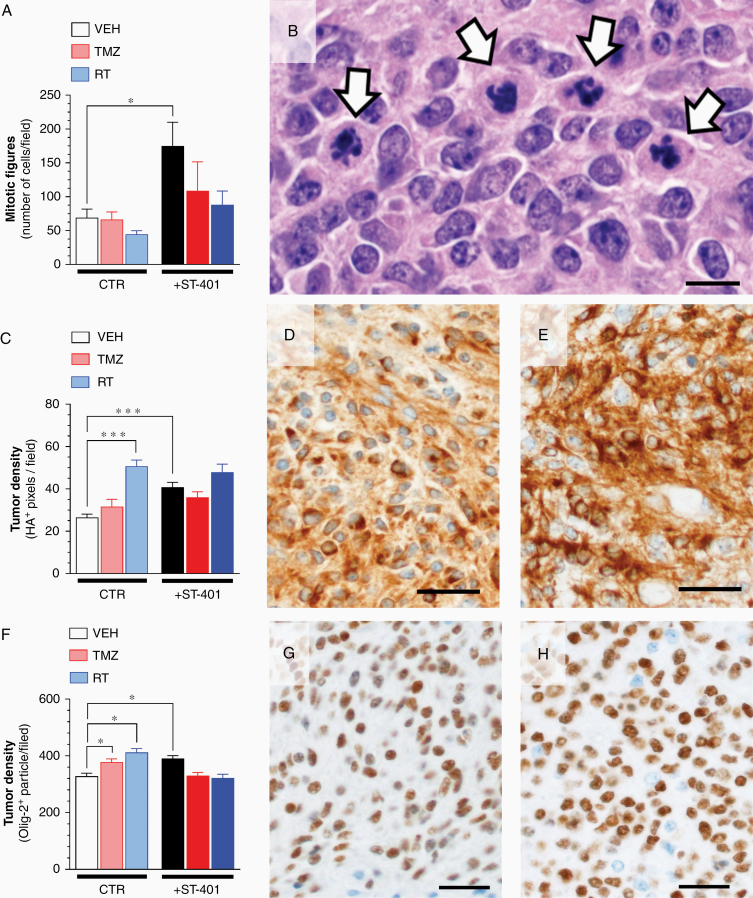
ST-401 disrupts mitosis and enhances PDGFB-glioma tumor density. (A) ST-401 increases the number mitotic figures in PDGFB-glioma as determined by H&E histopathological analysis. (B) Representative H&E stained section of PDGFB-glioma treated with ST-401 illustrating disrupted mitotic figures (arrows). Scale bar = 100 μm. (C) RT and ST-401 increase PDGFB-glioma tumor density as determined by HA imnumostaining. (D–E) Representative HA immunostaining of PDGFB-glioma from CTR (D) and ST-401 arms (E). Scale bars = 20 μm. (F) TMZ, RT and ST-401 increase PDGFB-glioma tumor density as determined by olig-2 imnumostaining. (G–H) Representative olig-2 immunostaining of PDGFB-glioma from CTR (G) and ST-401 arms (H). Tumor density (ie, % area) of positively-stained pixels counted by unbiased semi-quantitative analysis using Image J. Results are mean ± SEM from n = 5–8 brain sections per arm. Two-way ANOVA analysis followed by Tuckey's post-test indicated significant difference of ***P < .001, **P < .01 and *P < .05.

