Figure 3.

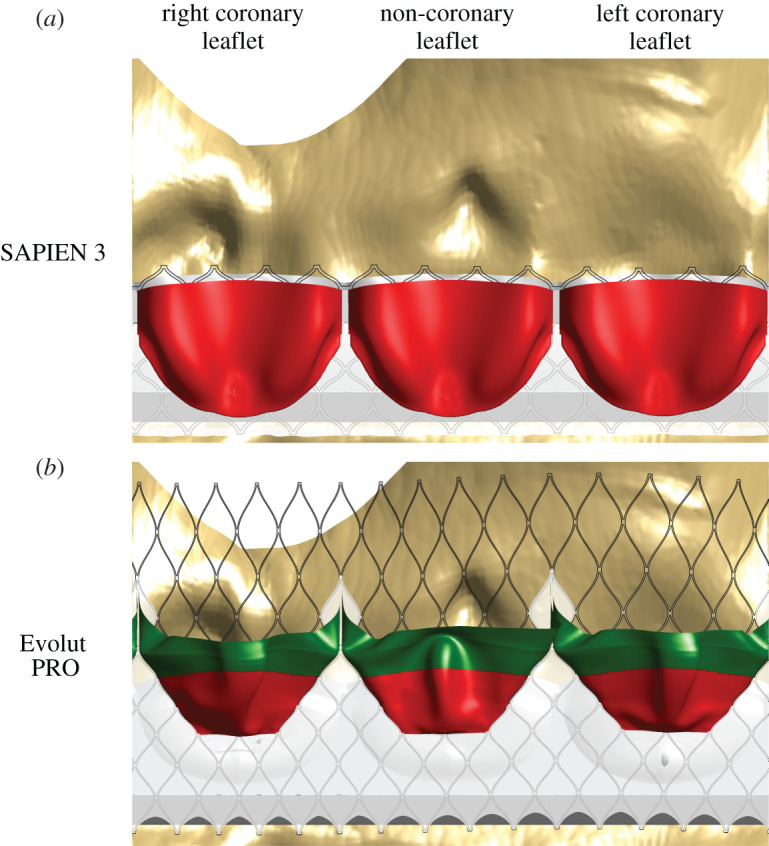
A spread view showing the leaflets' confinement in the SAPIEN (a) and Evolut (b) models. The confined regions of the TAVI leaflets are shown in red, while those that are not are displayed in green.

A spread view showing the leaflets' confinement in the SAPIEN (a) and Evolut (b) models. The confined regions of the TAVI leaflets are shown in red, while those that are not are displayed in green.