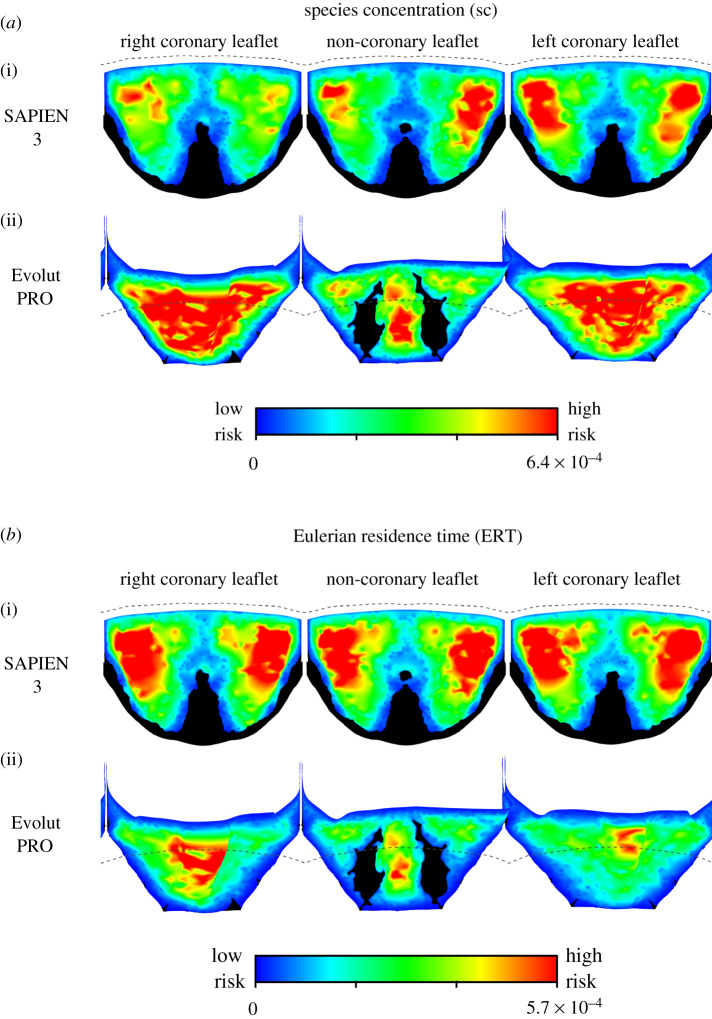
Figure 5.
A comparison of the Eulerian thrombogenicity approaches for the two TAVI devices. The SC results for both SAPIEN and Evolut are shown in (a), while the results of the ERT approach are shown in (b). High-risk locations are shown in red while low-risk areas are shown in blue. The dashed lines illustrate the leaflets' confinement by the surgical valve.

