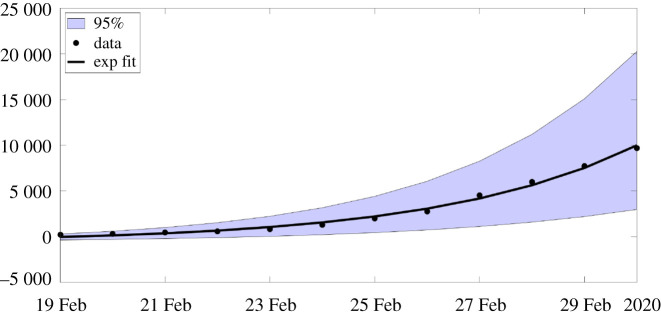
Figure 1.
In this figure, we plot the best fit of the exponential model to the cumulative number of reported cases of COVID-19 in mainland China between 19 February and 1 March. We obtain χ1 = 3.7366, χ2 = 0.2650 and χ3 = 615.41 with t0 = 19 Feb. The parameter χ3 is obtained by minimizing the error between the best exponential fit and the data.

