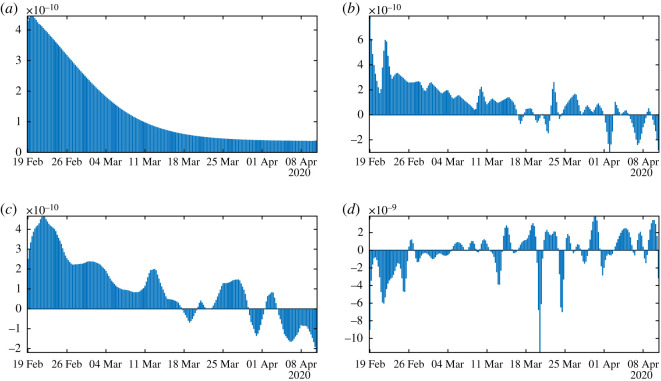
Figure 13.
In this figure, we plot the transmission rates t → τ(t) obtained by using algorithm 2 with the parameters f = 0.5 and ν = 0.2. We use the cumulative data obtained by using (a) the Bernoulli–Verhulst regularization, (b) the rolling weekly average regularization, (c) the Gaussian weekly average regularization and in (d) we use the original cumulative data.

