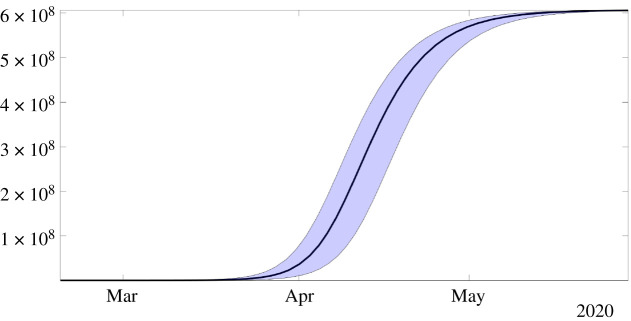
Figure 2.
In this figure, the black curve corresponds to the cumulative number of reported cases CR(t) obtained from the model (2.6) with CR′(t) = νf I(t) by using the values I0 = 1521 and τ0 = 3.32 × 10⁻¹⁰ obtained from our method and the early data from 19 February to 1 March. The blue region corresponds to the confidence interval when the rate of transmission τ(t) is constant and equal to the estimated value τ0 = 3.32 × 10⁻¹⁰.

