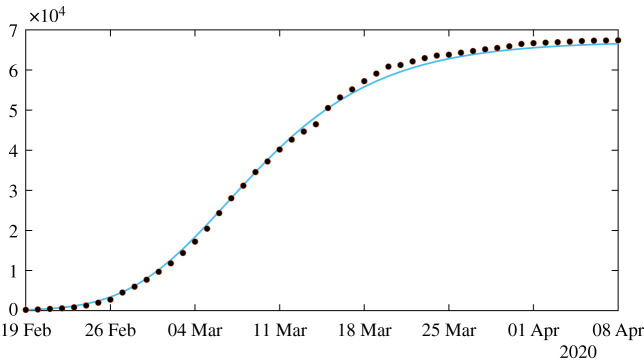
Figure 5.
In this figure, we plot the number of reported cases by using model (1.1) and (1.3), with the rate of transmission obtained in (4.5). The parameters values are f = 0.5, ν = 0.1 or ν = 0.2, χ2 = 0.66 and θ = 0.22, and CR∞ = 67 102 is the latest value obtained from the cumulative number of reported cases for China. Furthermore, we use S0 = 1.4 × 10⁹ for the total population of China and I0 = 954 which is obtained from formula (4.3). The black dots correspond to observed data for the cumulative number of reported cases and the blue curve corresponds to the model.

