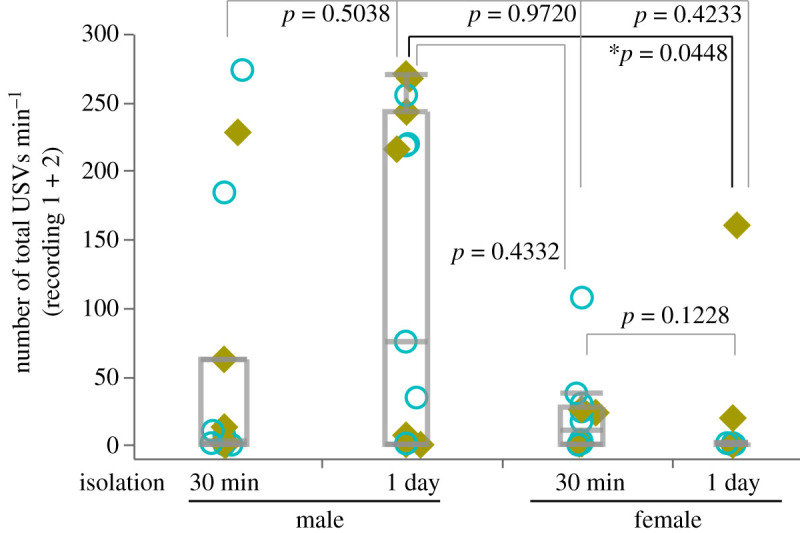
Figure 3.

Comparison of the total number of USVs among groups. The total number of USVs (recording 1 + 2) per min among groups is shown. *p < 0.05, Steel–Dwass test after Kruskal–Wallis test; male 30 min and 1 day isolation, n = 15; female 30 min isolation, n = 11, female 1 day isolation, n = 14. The counter-balanced order of experimental contents for recording 1 and 2 in each individual is indicated as in figures 1 and 2: Blue open circle, fam–unfam; lime yellow closed square, unfam–fam.
