Figure 4.

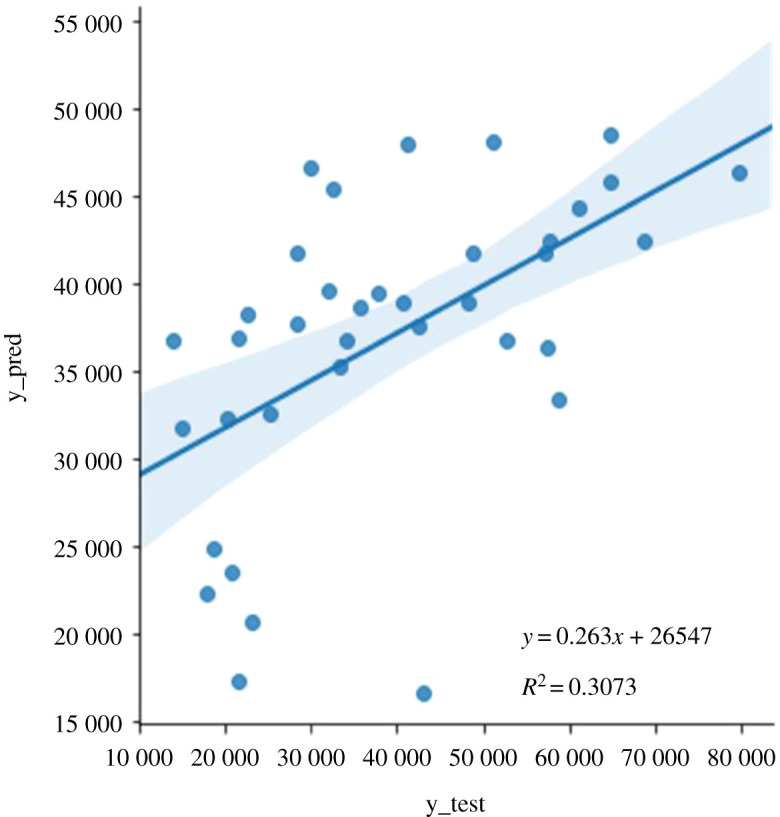
Actual versus predicted plot showing the actual targets from the test dataset (y_test) against the predicted values by the random forest model (y_pred).

Actual versus predicted plot showing the actual targets from the test dataset (y_test) against the predicted values by the random forest model (y_pred).