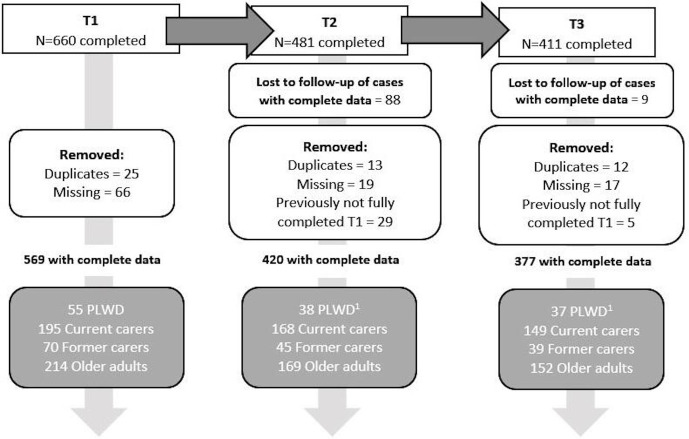
Figure 1.
Flow of participation in longitudinal survey. The top boxes indicate how many people completed each survey timepoint. After having removed (1) duplicates (people who completed the survey two times), (2) missing cases (where participants had not completed the Personalised Health Questionnaire 9, Generalised Anxiety Disorder 7, and the Short Warwick-Edinburgh Mental Well-Being Scale or had missing ID codes at T2 and T3) and (3) losses to follow-up (those that had either completed T1 or T1 and T2 only), and (4) incomplete data at T1 yet data at T2 or T3, 377 cases remained in total. Grey boxes indicate the breakdown by subgroup. 1 Follow-up completion by subgroup by percentage at T2 and T3 compared with T1: people living with dementia (PLWD) 69% (T2), 67% (T3); Current carers 86% (T2), 75% (T3); Former carers 64% (T2), 60% (T3); Older adults 79% (T2), 69% (T3).

