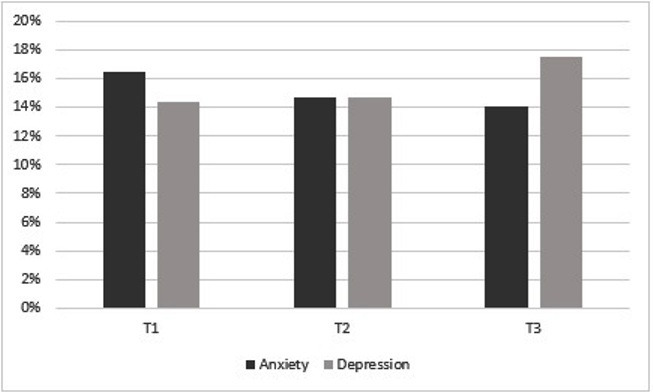
Figure 3.

Proportion of the total sample who scored above the cut offs for anxiety and depression at three timepoints.T=Timepoin. The graph shows the proportion of participants from the total sample who completed all three surveys (n=377) and scored above the cut-off on the Generalised Anxiety Disorder 7 and Personalised Health Questionnaire 9 for anxiety and depression, respectively.
