Figure 4.
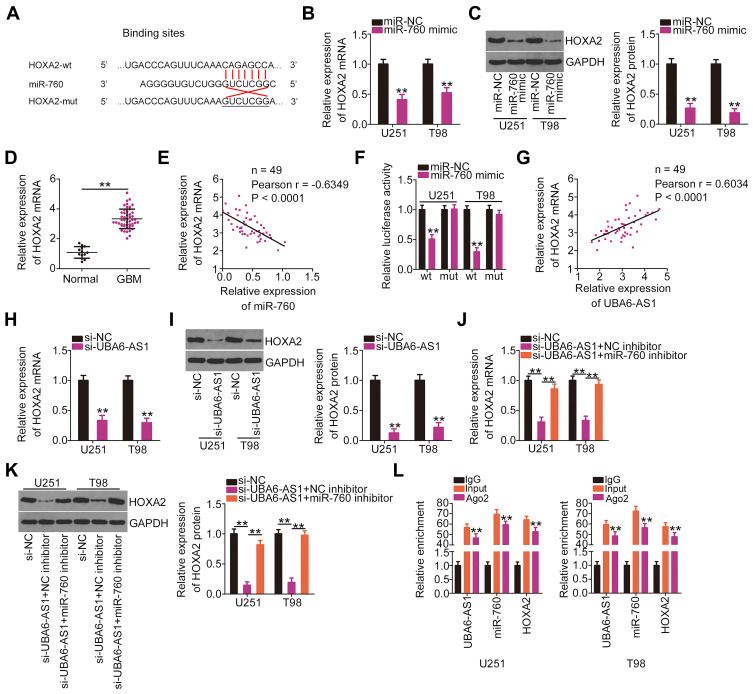
UBA6-AS1 increases the expression of HOXA2 in GBM cells by sponging miR-760. (A) Wild-type and mutant binding sites between miR-760 and the 3ʹ-untranslated region of HOXA2. (B, C) The mRNA and protein levels of HOXA2 in U251 and T98 cells transfected with miR-760 mimic or miR-NC were determined by RT-qPCR analysis and Western blotting, respectively. (D) HOXA2 mRNA in 49 GBM tissues and 13 normal brain tissues was detected by RT-qPCR analysis. (E) Pearson’s correlation analysis of miR-760 and HOXA2 mRNA levels in the 49 GBM tissues. (F) Luciferase reporter assay was employed to measure the luciferase activity of U251 and T98 cells following co-transfection with miR-760 mimic or miR-NC and HOXA2-wt or HOXA2-mut. (G) The correlation between the levels of HOXA2 mRNA and UBA6-AS1 in the 49 GBM tissue samples was tested by Pearson’s correlation analysis. (H, I) RT-qPCR analysis and Western blotting were used to determine HOXA2 mRNA and protein levels in U251 and T98 cells transfected with si-UBA6-AS1 or si-NC. (J, K) U251 and T98 cells were transfected with miR-760 inhibitor or NC inhibitor along with si-UBA6-AS1. The mRNA and protein levels of HOXA2 were determined by RT-qPCR analysis and Western blotting, respectively. (L) Radioimmunoprecipitation assay was performed with IgG and Ago2 antibody, followed by RT-qPCR analysis of UBA6-AS1, miR-760 and HOXA2 enrichment. **P < 0.01.
Abbreviations: GBM, glioblastoma; RT-qPCR, reverse transcription-quantitative PCR; HOXA2, homeobox A2; wt, wild-type; mut, mutant; Ago2, Argonaute 2; GAPDH, glyceraldehyde-3-phosphate dehydrogenase; miR, microRNA; miR-NC, negative control miRNA mimic; UBA6-AS1, UBA6 antisense RNA 1; si-NC, negative control small interfering RNA; si-UBA6-AS1, small interfering RNA targeting UBA6-AS1; NC inhibitor, negative control inhibitor.

