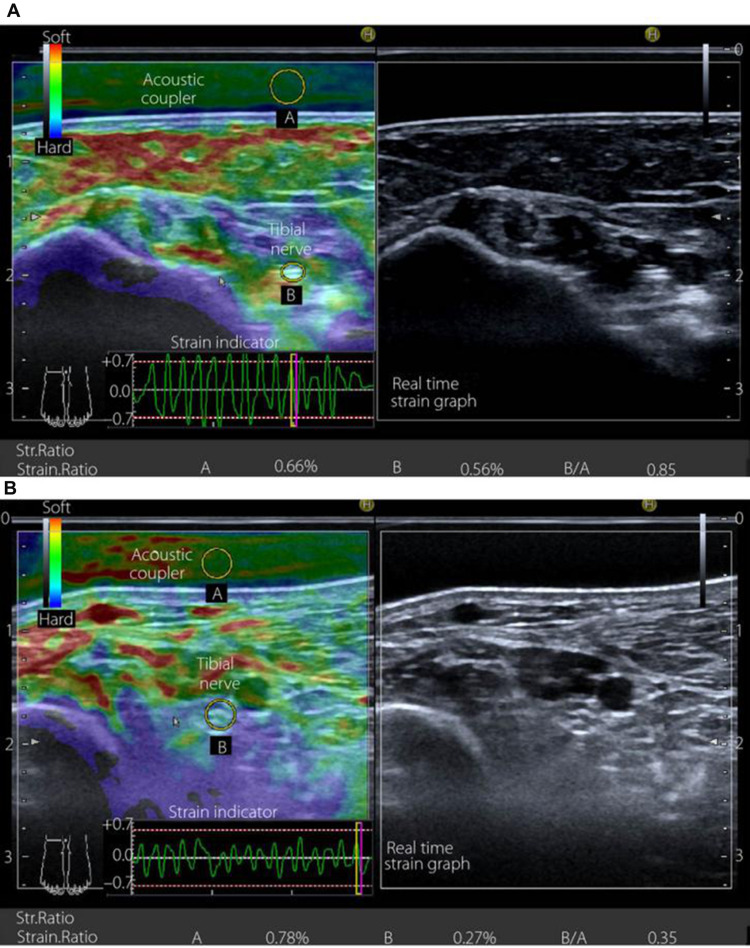
Figure 7.
Transverse sectional image of the tibial nerve in (A) a 48‐year‐old male control participant and (B) a 52‐year‐old male patient with type 2 diabetes at stage III neuropathy, visualized by high‐resolution ultrasonography using an 18.0‐MHz linear array probe (HIVISION Ascendus; Hitachi Medical, Tokyo, Japan) attached with an acoustic coupler (EZU‐TECPL1; Hitachi‐Aloka Medical, Tokyo, Japan). A translucent color‐coded image represents the relative stiffness of tissues. Mild compression and decompression using a probe attached with an acoustic coupler were repeated on the tibial nerve. Representative sonoelastographic images were chosen from images stored as cine loops. The tibial nerve and region of the acoustic coupler located directly above the tibial nerve are shown with a circle. The elastograms were constructed automatically. The elasticity of the tibial nerve was assessed as the tibial nerve:acoustic coupler strain ratio. The measurements were repeated three times and averaged. Reproduced from Ishibashi F, Taniguchi M, Kojima R, Kawasaki A, Kosaka A, Uetake H, Elasticity of the tibial nerve assessed by sonoelastography was reduced before the development of neuropathy and further deterioration associated with the severity of neuropathy in patients with type 2 diabetes. J Diabetes Investig. 7(3):404–412. Copyright © [2015], John Wiley and Sons.66

