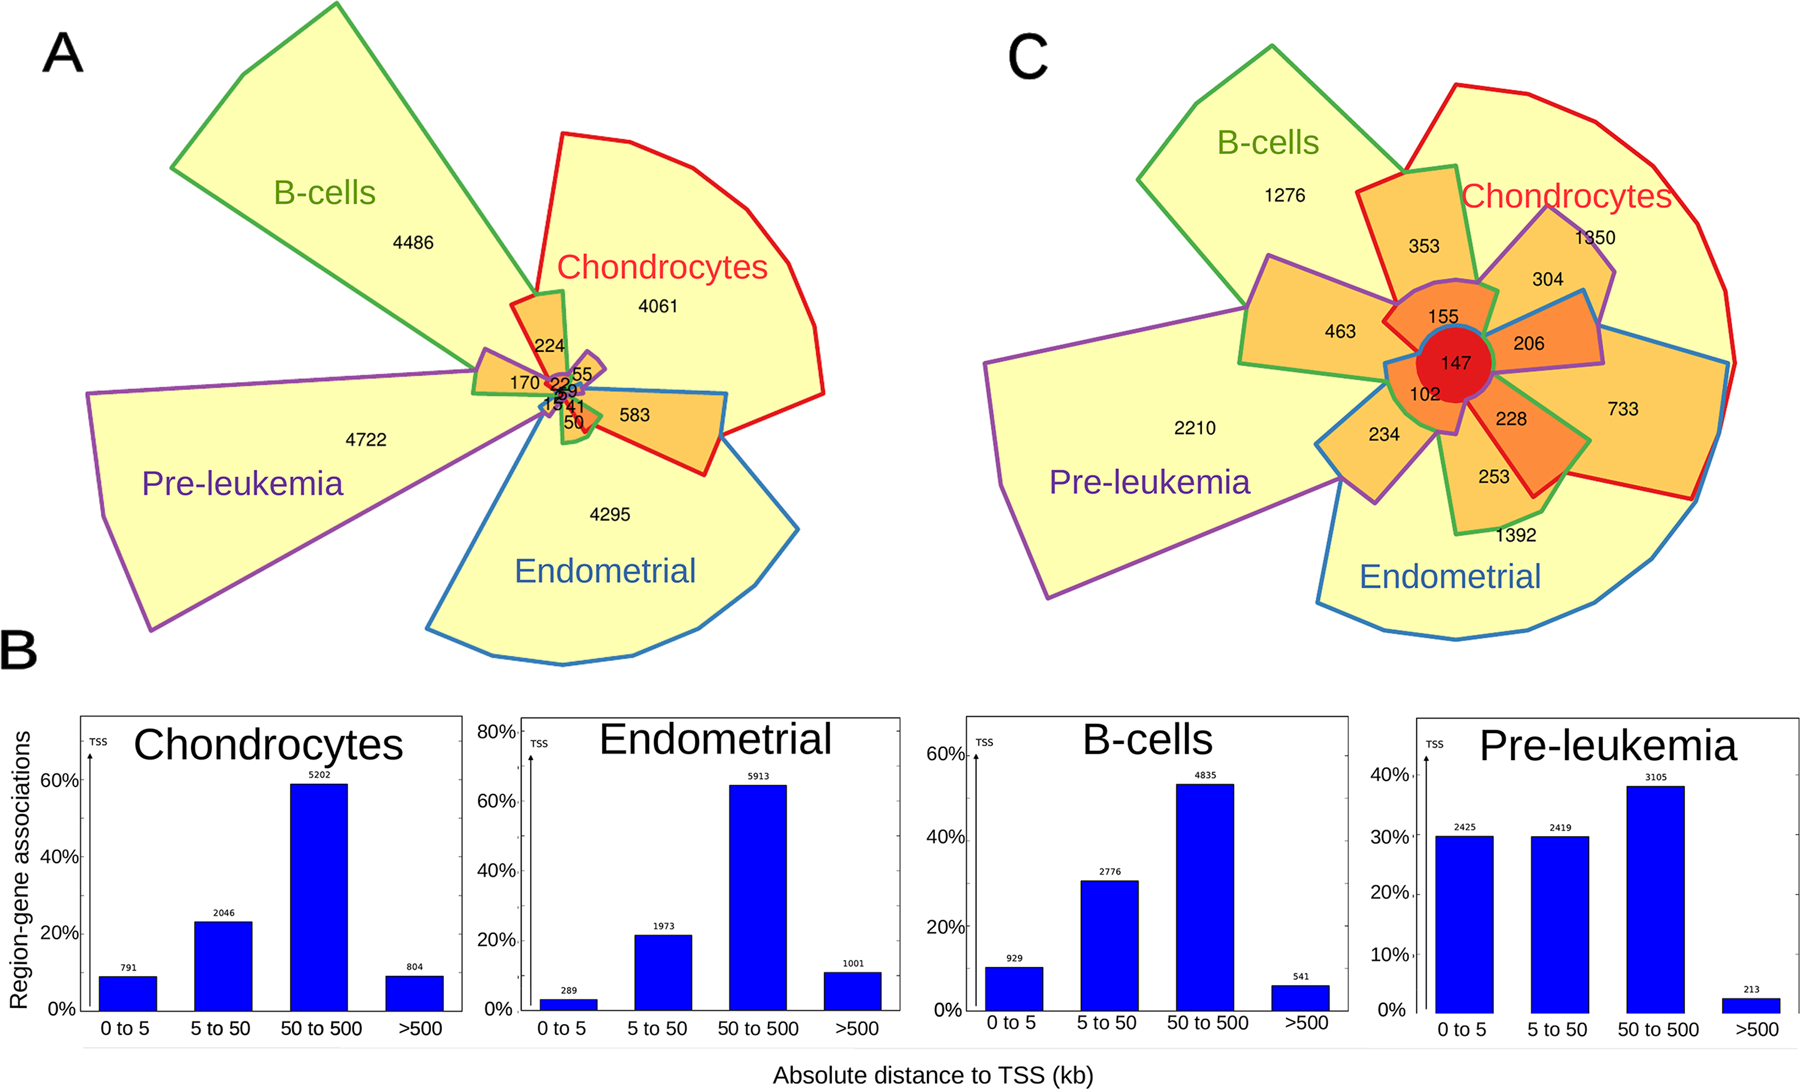
Figure 4. FOXO1 binding is highly tissue-specific.

A) Chow-Ruskey diagram showing a 4-way overlap between FOXO1 peaks from 4 human cell types. The area of each region is proportional to the number of overlapping FOXO1 peaks. Each region is color-coded according to the number of overlapping FOXO1 peaks from each cell type: FOXO1 peaks overlapping in all four cell types (red), three cell types (dark orange), two cell types (light orange) and present in only one cell type (yellow). Cell types are also color-coded: B-cells (green), chondrocytes (red), endometrial (blue) and pre-leukemia (purple).
B) Histograms depicting the binned distribution of FOXO1 binding distance to the nearest TSS in 4 human cell types.
C) Chow-Ruskey diagram showing a 4-way overlap between FOXO1 putative target genes from 4 human cell types. The area of each region is proportional to the number of overlapping FOXO1 putative target genes. Each region is color-coded according to the number of overlapping FOXO1 putative target genes from each cell type: FOXO1 putative target genes shared by all four cell types (red), three cell types (dark orange), two cell types (light orange) and present at only one cell type (yellow). Cell types are also color-coded: B-cells (green), chondrocytes (red), endometrial (blue) and pre-leukemia (purple).
