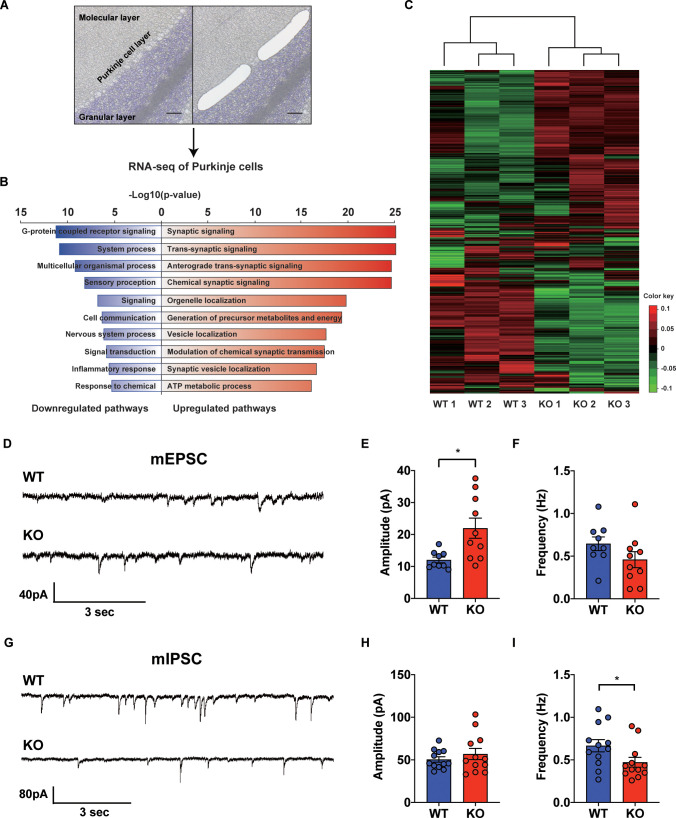
Figure 2. Transcriptional regulation of synaptic signaling and transmission in the STAT3PKO mice.
(A) Schematic representation of RNA sequencing analysis of Purkinje cells (PCs) from wild-type (WT) and STAT3PKO mice. PC layers were isolated using laser capture microdissection. Scale bar = 100 μm. (B) The upregulated/downregulated pathways for the STAT3PKO mice compared to WT. Gene ontology (GO) analysis was performed using significantly up- and downregulated genes in Figure 2—figure supplement 1. Bar graph for the most significant GO pathways. (C) Heatmap depicting 579 differentially expressed transcripts in synaptic signaling. Estimated read count was rlog transformed using DEseq2, then gene centered and normalized for heatmap value. (D) Representative traces for the miniature excitatory postsynaptic currents (mEPSCs) in WT and STAT3PKO mice. (E) Bar graph for the average of mEPSCs amplitude (WT vs. STAT3PKO; 12.0 ± 0.886 vs. 21.9 ± 3.13, p=0.00980, n = 9, 10 cells; two-tailed Student’s t-test). (F) Bar graph for the average of mEPSCs frequency (WT vs. STAT3PKO; 0.645 ± 0.0803 vs. 0.459 ± 0.0933, p=0.153, n = 9, 10 cells; two-tailed Student’s t-test). (G) Representative traces for the miniature inhibitory postsynaptic currents (mIPSCs) in WT and STAT3PKO mice. (H) Bar graph for the average of mIPSC amplitude (WT vs. STAT3PKO; 50.4 ± 3.22 vs. 59.3 ± 7.39, p=0.222, n = 12, 7 cells; two-tailed Student’s t-test). (I) Bar graph for the mIPSC frequency (WT vs. STAT3PKO; 0.666 ± 0.0723 vs. 0.424 ± 0.0316, p=0.0252, n = 12, 7 cells; two-tailed Student’s t-test). Data are presented as mean ± SEM, and *p<0.05, **p<0.01.


