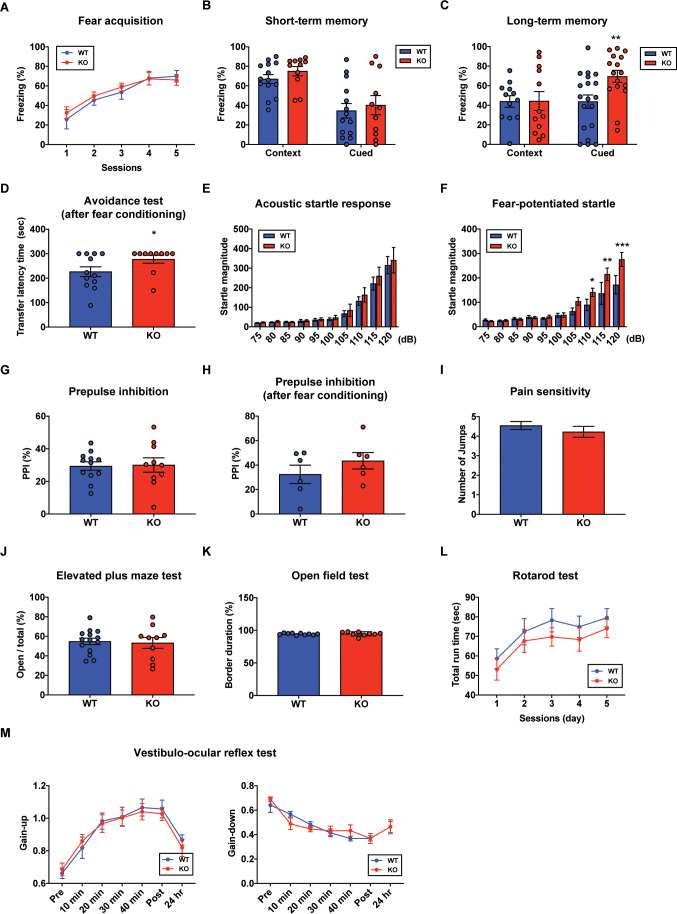
Figure 4. Aberrant long-term fear memory in the STAT3PKO mice.
(A) The percentage of freezing time spent during fear acquisition (genotype × time interaction: F(4,56)=0.276, p=0.892; genotype effect: F(1,14)=0.260, p=0.617; time effect: F(4,56)=14.9, p<0.001, n = 7, nine mice; wild-type (WT) and STAT3PKO groups, respectively; two-way ANOVA with Bonferroni correction). (B) The percentage of freezing time spent in short-term contextual and cued fear memory tests (WT vs. STAT3PKO, context: 67.0 ± 4.54 vs. 75.0 ± 4.79, p=0.198, n = 14, 11 mice, Mann–Whitney test; WT vs. STAT3PKO, cued: 34.5 ± 7.44 vs. 40.2 ± 9.84, p=0.702, n = 14, 11 mice, Mann–Whitney test). (C) The percentage of freezing time spent in long-term contextual and cued fear memory tests (WT vs. STAT3PKO, context: 43.9 ± 5.84 vs. 44.3 ± 9.67, p=0.967, n = 12, 12 mice, two-tailed Student’s t-test; WT vs. STAT3PKO, cued: 43.7 ± 6.80 vs. 69.4 ± 6.21, p=0.00960, n = 19, 16 mice, two-tailed Student’s t-test). (D) The transfer latency time was assessed in the step-through passive avoidance test (WT vs. STAT3PKO, 226 ± 20.1 vs. 277 ± 16.1, p=0.0452, n = 12, 10 mice, Mann–Whitney test). (E) The startle magnitude in a wide range of sound intensities was assessed in the acoustic startle response test (n = 12, 12 mice; WT and STAT3PKO groups, genotype × sound interaction: F(9,198)=0.208, p=0.993; genotype effect: F(1,22)=0.423, p=0.521; sound effect: F(9,198)=48.7, p<0.001; two-way ANOVA with Bonferroni correction). (F) After fear conditioning, the startle magnitude in a wide range of sound intensities was assessed in the acoustic startle response test (n = 10, 10 mice; WT and STAT3PKO groups, genotype × sound interaction: F(9,162)=2.84, p=0.00390; genotype effect: F(1,18)=4.42, p=0.0496; sound effect: F(9,162)=36.3, p<0.001; two-way ANOVA with Bonferroni correction). (G) Comparison between WT and STAT3PKO mice in prepulse inhibition test (WT vs. STAT3PKO, 29.42 ± 2.57 vs. 30.0 ± 4.39, p=0.895, n = 12, 10 mice, two-tailed Student’s t-test). (H) The percentage of prepulse inhibition of WT and STAT3PKO mice after fear conditioning (WT vs. STAT3PKO, 32.4 ± 7.51 vs. 43.5 ± 6.71, p=0.297, n = 6, six mice, two-tailed Student’s t-test). (I) Measurement of the number of jumps during fear learning session for pain sensitivity (WT vs. STAT3PKO; p=0.374, n = 11, 10 mice, Mann–Whitney test). (J) The percentage of time spent in the open arms of plus arms (WT vs. STAT3PKO, 54.7 ± 3.34 vs. 53.1 ± 5.50, p=0.797, n = 14, 10 mice, two-tailed Student’s t-test). (K) The percentage of time spent in the border of the open field (WT vs. STAT3PKO, 94.3 ± 0.438 vs. 94.6 ± 1.05, p=0.808, n = 10, nine mice, two-tailed Student’s t-test). (L) Total run time on the rotating drum (n = 14, 15 mice; WT and STAT3PKO groups, respectively, genotype × session interaction: F(4,108)=0.0520, p=0.994; genotype effect: F(1,27)=0.143, p=0.241; session effect: F(4,108)=6.12, p<0.001; two-way repeated measured ANOVA with Bonferroni correction). (M) Vestibulo-ocular reflex (VOR) gain through 50 min of gain-up and -down training sessions, and at 24 hr point after training (gain-up: n = 9, seven mice; WT and STAT3PKO groups, respectively, genotype × time interaction: F(6,84)=0.396, p=0.879; genotype effect: F(1,14)=0.0247, p=0.877; time effect: F(6,84)=31.8, p<0.001, gain-down: n = 6 mice; WT and STAT3PKO groups, genotype × time interaction: F(6,60)=0.169, p=0.138; genotype effect: F(1,10)=0.00200, p=0.965; time effect: F(6,60)=28, p<0.001; two-way ANOVA with Bonferroni correction). Data are presented as mean ± SEM, and *p<0.05, **p<0.01, ***p<0.001.

