. 2020 Dec 23;9:e59073. doi: 10.7554/eLife.59073

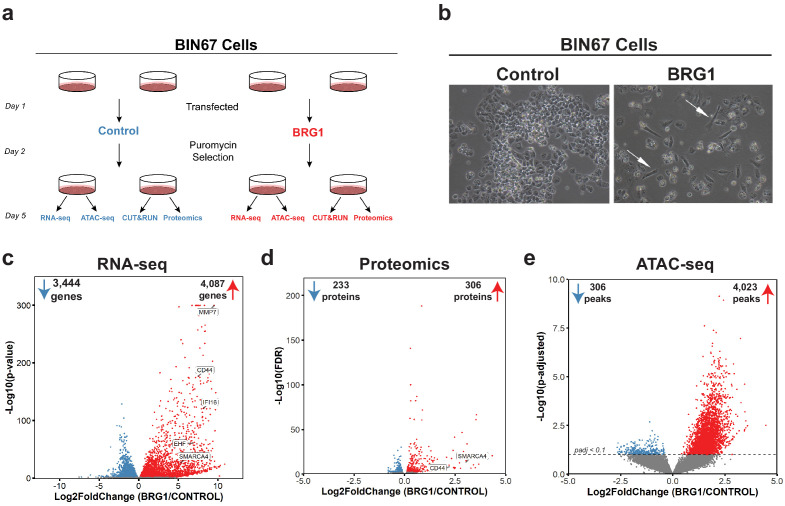
Figure 1. BRG1 reexpression induces global morphological, transcriptomic, and epigenetic changes in BIN67 cells.

(a) Experimental design for BRG1 reexpression in BIN67 cells and multi-omic data analysis. (b) Following the experimental design in 1a, pictures were taken at 10X phase. BIN67 cells transfected with BRG1 show an elongated morphology (white arrows) relative to control. Additional fields and controls shown in Figure 1—figure supplement 1. (c) Volcano plot results of RNA-seq differential gene expression (BRG1/Control) for protein coding genes using DESeq2 (n = 18,507 genes total). Significantly upregulated genes (padj <0.05 and Log2FoldChange > 0) are colored in red (n = 4087 genes). Significantly downregulated genes (padj <0.05 and Log2FoldChange < 0) are colored in blue (n = 3444 genes). Non-significant genes are colored in gray (n = 10,976 genes). SMARCA4/BRG1 and BRG1 target genes are identified. (d) Volcano plot of differential expressed proteins for BIN67 +/- BRG1 reexpression by PECA analysis (n = 5726 total proteins identified). Significantly upregulated proteins (p.fdr <0.05 and Log2FoldChange > 0) are colored in red (n = 306 proteins). Significantly downregulated proteins (p.fdr <0.05 and Log2FoldChange < 0) are colored in blue (n = 233 proteins). Non-significant proteins are identified in gray (n = 5187 proteins). Proteins of SMARCA4/BRG1 and CD44 are identified. (e) Differential peak analysis for ATAC-seq data using DESeq2 (n = 62,308 peaks total). Significantly gained ATAC-seq peaks (padj <0.10 and Log2FoldChange > 0) are identified in red (Gained; n = 4,023). Significantly lost ATAC-seq peaks (padj <0.10 and Log2FoldChange < 0) are identified in blue (Lost; n = 306). Non-significant peaks are identified in Gray (Static/N.S.; n = 57,979). Source data is available in Figure 1—source data 1.

Figure 1—source data 1. Raw data for Figure 1.

Figure 1.

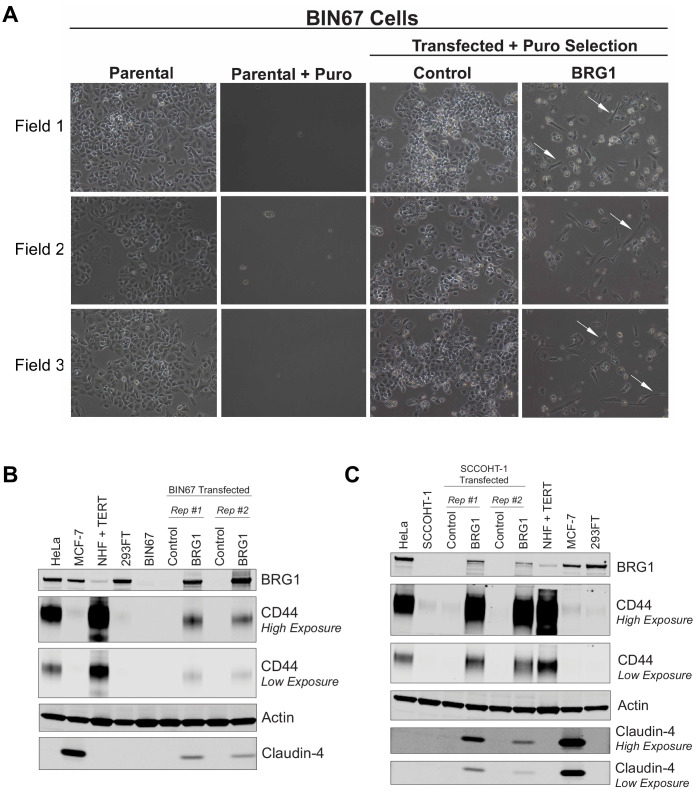
Figure 1—figure supplement 1. Morphology and protein expression changes in SCCOHT cells following BRG1 reexpression.

Figure 1—figure supplement 1.

(A) Three different fields taken randomly across two biological replicates of BIN67 cells +/- BRG1 reexpression flowing experimental design in Figure 1a. Pictures were taken at 10X phase prior to harvest. BIN67 cells transfected with BRG1 show an elongated morphology (white arrows) relative to control. BIN67 (parental) cells at similar passage are shown for morphology comparison. Untransfected controls treated with puromycin (Parental + Puro) are shown for each experiment. Control and BRG1 transfected for Field one are shown in Figure 1b. Field one is from biological replicate #1 and Field two and Field three are from biological replicate #2. (B, C) Western blots for (B) BIN67 and (C) SCCOHT-1 cells +/- BRG1 compared to other cancer cell lines. Reexpression studies were performed in biological duplicate.
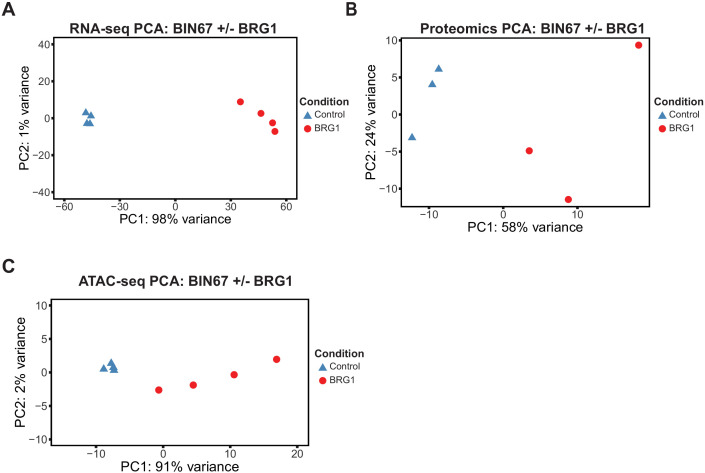
Figure 1—figure supplement 2. Unsupervised analysis for multi-omics samples.

Figure 1—figure supplement 2.

Principal component analysis (PCA) for RNA-seq (A), Proteomics (B), ATAC-seq (C). A, PCA for RNA-seq samples was performed by DESeq2 on rlog transformed counts. (B) PCA was performed by prcomp on log2 transformed counts for proteomics samples. (C) PCA was performed on rlog transformed counts under called ATAC-seq peaks by DESeq2.
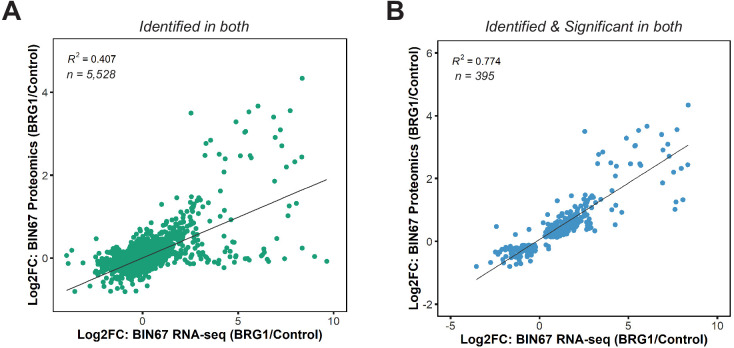
Figure 1—figure supplement 3. Correlation of RNA-seq and proteomics data in BIN67 cells.

Figure 1—figure supplement 3.

(A) Scatterplot of gene expression changes and protein expression changes for proteins and genes identified in both (n = 5528). For instances where multiple proteins mapped to a particular gene, the average log2foldchange of protein abundance was calculated. (B) Scatterplot of gene expression changes and protein expression changes for proteins and genes identified as significant in both (RNA-seq: padj <0.05, Proteomics: FDR < 0.05). For instances where multiple proteins mapped to a particular gene, the average log2foldchange of protein abundance was calculated.