
Figure 2: Similarity between mouse and human striatal astrocytes, relationship to disease, and reciprocal pathway changes between Gi-GPCR activation and HD.
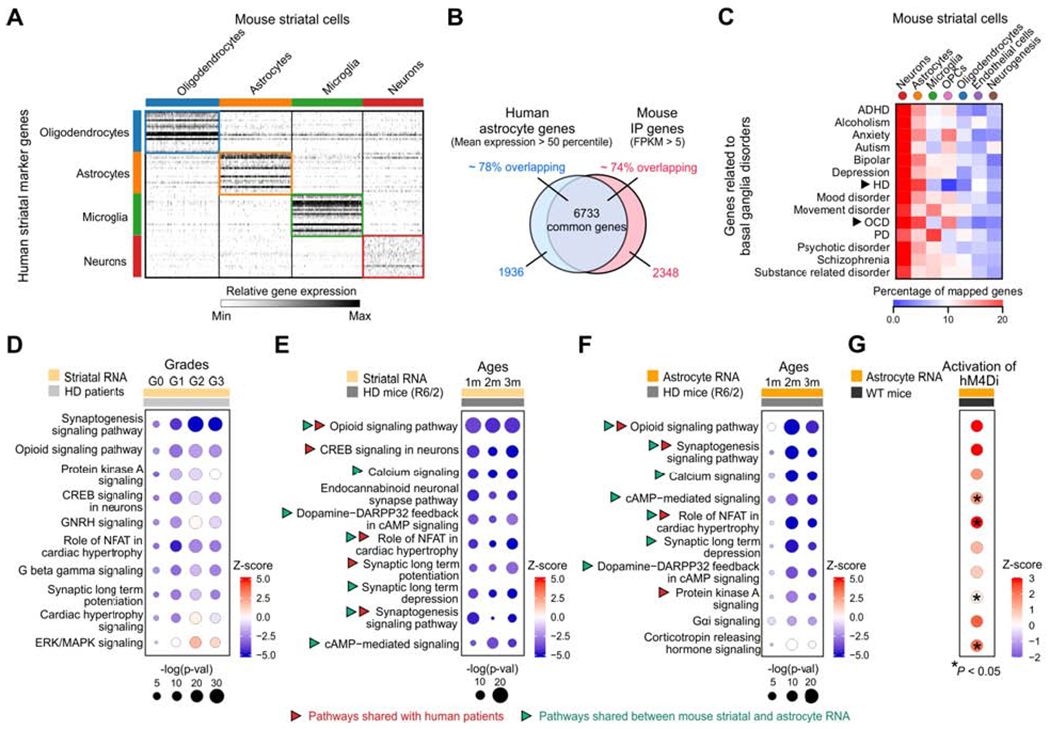
(A) Heat map of relative expression of human striatal marker genes for oligodendrocytes, astrocytes, microglia and neurons in mouse striatal scRNA-seq data (Figure S5). (B) The Venn diagram of overlap between highly expressed astrocyte genes in the human striatum (mean expression > 50 percentile) and mouse striatal IP sample (FPKM > 5). (C) The percentage genes related to basal ganglia disorders mapped onto mouse striatal scRNA-seq data based on the top 1000 cell type marker genes for the 7 major cell types. Arrows indicated the two disorders (HD and OCD) with the highest of astrocyte genes mapped. (D) Dot plots of the top 10 common canonical pathways in caudate nucleus RNA from HD patients that were altered at different grades (Diaz-Castro et al., 2019; Hodges et al., 2006), identified by IPA. Sizes of dots represent log-transformed p-value and colors indicate either pathway activation (red) or inhibition (blue) based on z-scores. (E,F) Top 10 common canonical pathways from striatal tissue bulk RNA-seq (E) and astrocyte-specific RNA-seq data (F) that were altered in HD mouse model (R6/2) at different ages (1 m, 2 m and 3 m of age). Red arrows indicate pathways shared in human and mouse RNA-seq data, while green arrows indicate pathways shared between mouse striatal RNA and astrocyte RNA. (G) Effects of hM4Di DREADD activation on the top 10 altered common pathways identified from astrocyte RNA-seq of R6/2 mice.