
Figure 8: Identification of endogenous GPCRs in HD mice as potential therapeutic targets.
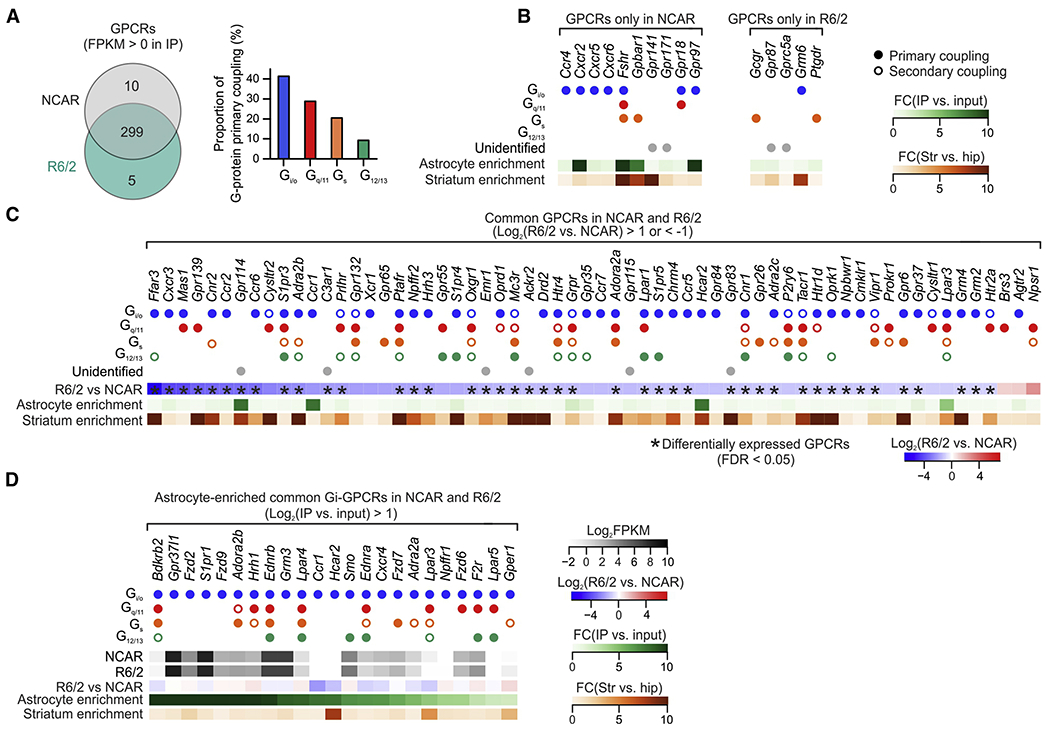
(A) GPCRs identified from striatal astrocyte RNA-seq data in NCAR and R6/2 at 3 months of age. The bar graph showing the proportion of primary coupling to G-proteins (Gi/o, Gq/11, Gs and G12/13). (B) Unique GPCRs that were present in NCAR and R6/2. Filled dots indicate primary G-protein coupling, while open dots indicate secondary G-protein coupling. Astrocyte enrichment was calculated as fold-change between striatal IP and striatal input RNA-seq data. Striatum enrichment was calculated as fold-change between striatal IP and hippocampal IP RNA-seq data. (C) Common GPCRs in the striatal astrocytes with > 2-fold increase or decrease between R6/2 and NCAR. Differentially expressed GPCRs (FDR < 0.05) are highlighted by asterisks. (D) GPCRs primarily coupled to Gi that were enriched in astrocytes and present in both R6/2 and NCAR. All listed GPCRs displayed >2-fold astrocyte enrichment and were not significantly altered in R6/2 compared with NCAR (FDR > 0.05). FPKM values presented as log2FPKM. All GPCRs reported in Excel file S5.