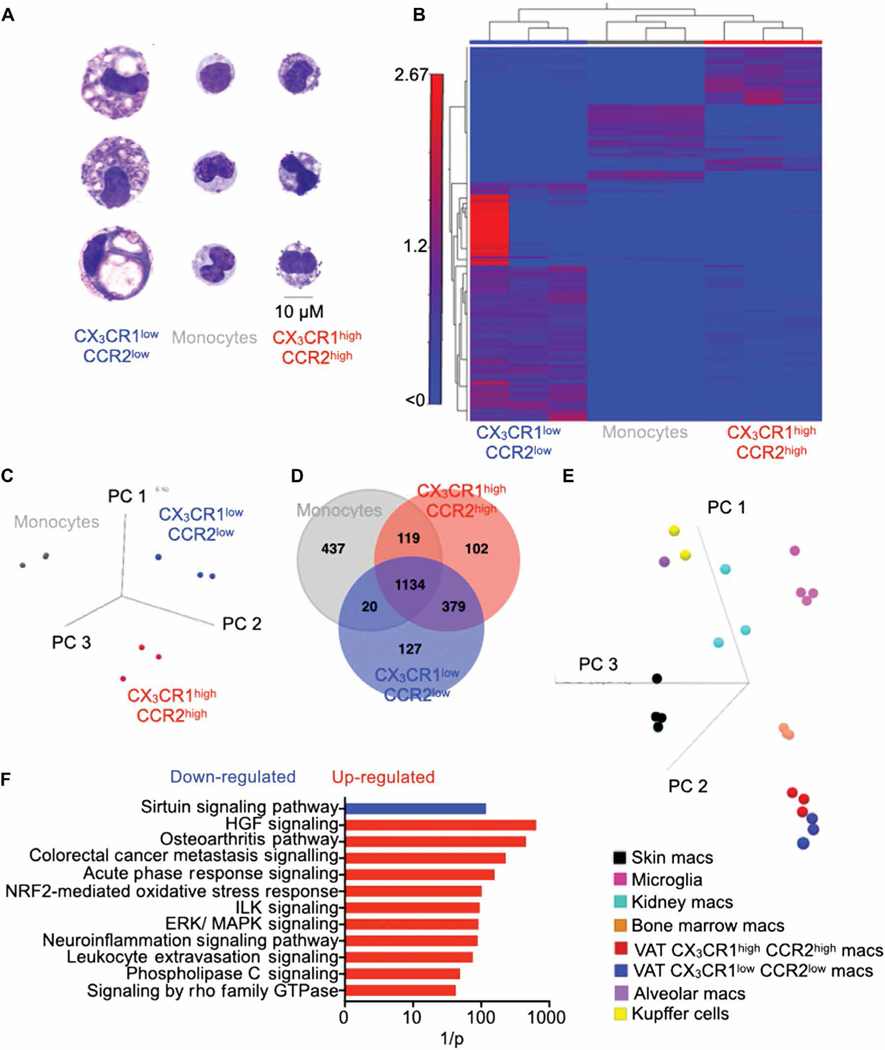
Fig. 3. VAT-resident macrophages exhibit a unique transcriptome profile.
All experiments were performed in lean C57BL/6 mice without MI. (A) Assessment of morphology of isolated blood monocytes and VAT macrophages by Wright-Giemsa staining. Scale bar, 10 μm. (B) The heatmap displays genes obtained from RNA sequencing analysis with at least twofold difference between the VAT macrophage subsets (FDR < 0.05). Principal components analysis (PCA) (C) and a Venn diagram (D) showing differentially expressed genes among monocytes and the VAT macrophage subsets. PCA plot (E) and bar graph (F) compare VAT macrophages to other tissue-resident macrophages. n = 3 per group.

