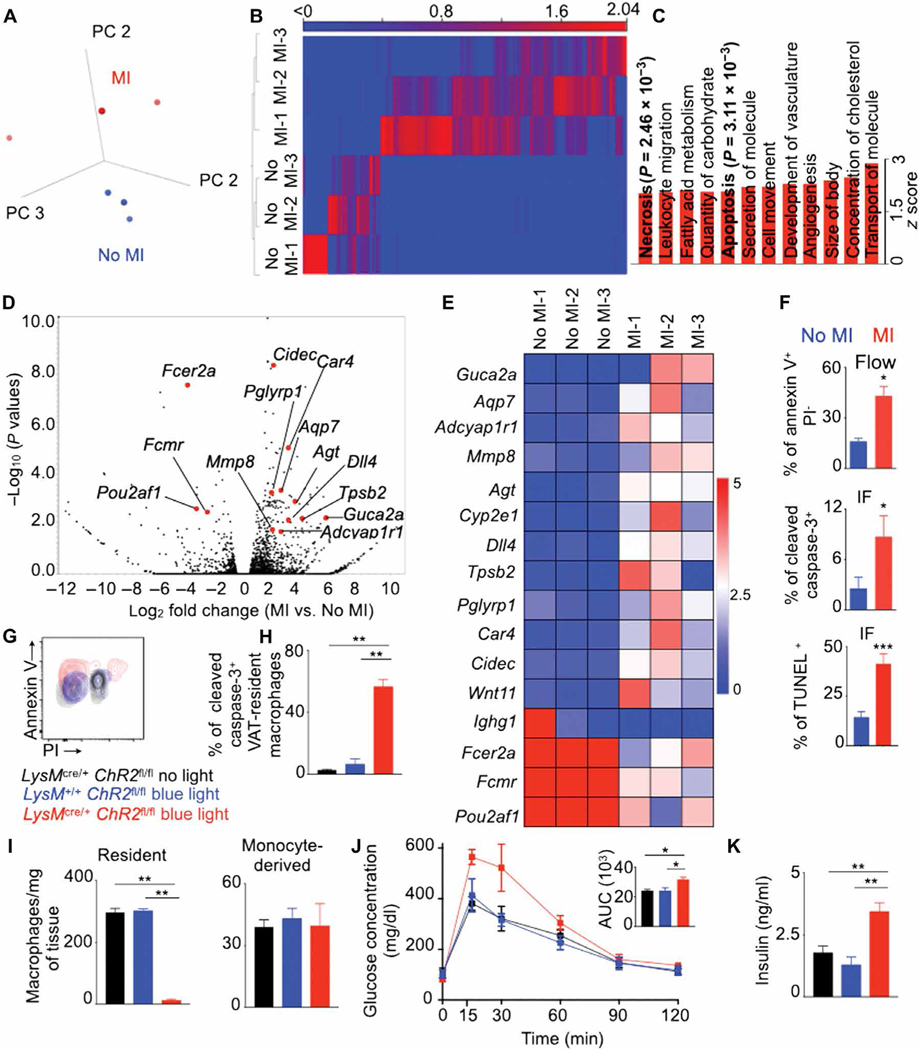
Fig. 6. Apoptosis of VAT-resident macrophages after MI increases glucose intolerance.
Experiments were performed in lean C57BL/6 mice on day 7 after MI. (A) PCA of RNA sequencing data comparing the transcriptomic profiles of VAT-resident macrophages isolated from mice with or without MI. (B) Differentially expressed genes with a 2 log2 fold cutoff and FDR < 0.05. (C) Functional pathways increased in VAT-resident macrophages in mice with MI. (D) Volcano plot and (E) heatmap showing genes involved in cellular apoptosis. n = 3 for (A) to (E). (F) Quantification of annexin V+ propidium iodide (PI), cleaved caspase-3+, and TUNEL+ VAT-resident macrophages by flow cytometry and confocal microscopy. n = 10 per group. (G to K) MI was performed in lean LysMcre/+ ChR2fl/fl and control mice on day 5 after blue light exposure. (G and H) Annexin V and caspase-3 expression in VAT-resident macrophages on day 1 after blue light exposure. (I) Enumeration of VAT-resident and monocyte-derived macrophages on day 5 after blue light exposure. A GTT was performed (J), and serum insulin concentrations were measured (K) in mice 7 days after MI (6 days after blue light exposure). n = 4 per group for (G) to (K). AUC, area under the curve. Means ± SEM. *P < 0.05, **P < 0.01, and ***P < 0.001.

