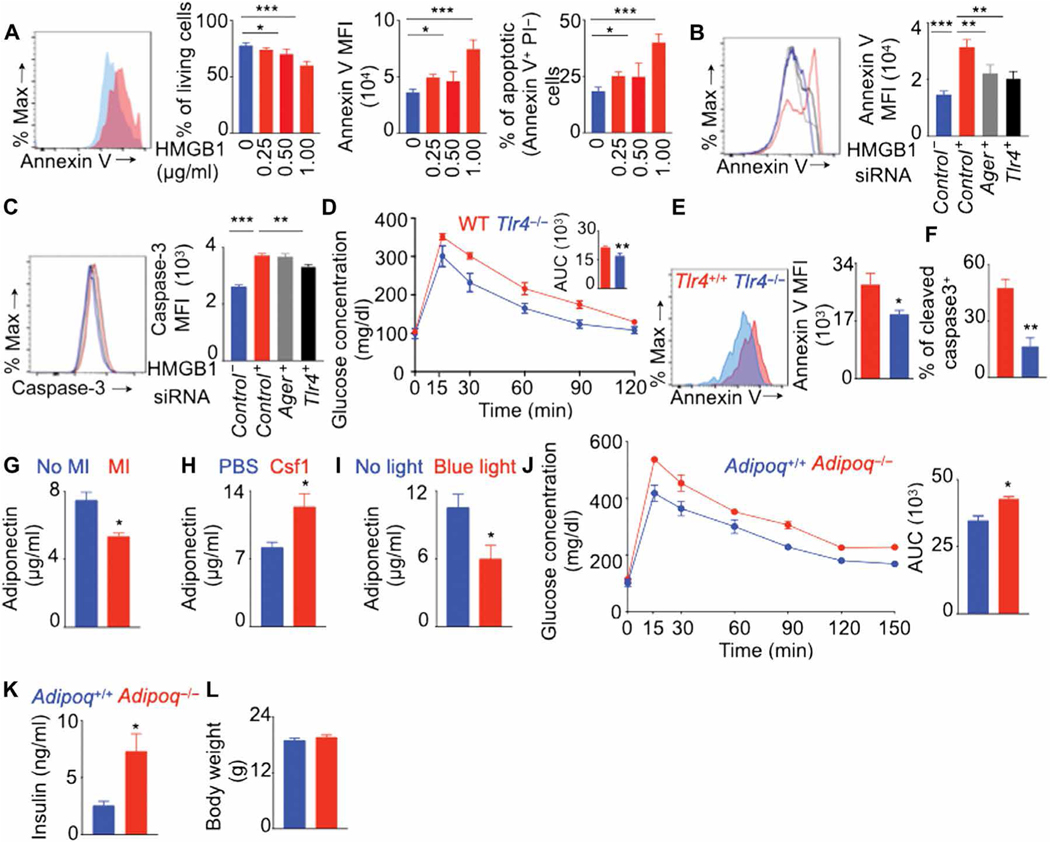
Fig. 8. Decreased adiponectin content after MI induces glucose intolerance.
(A) Bone marrow–derived macrophages were cultured with various concentrations of HMGB1. Flow cytometry quantified the frequency of live cells, annexin V expression, and proportions of apoptotic cells. n = 6 per group. (B and C) Tlr4 and Ager were knocked down in BMDM using siRNA, and these cells were cultured with or without HMGB1. n = 5 per group. Annexin V (B) and cleaved caspase-3 (C) expression was quantified using flow cytometry. GTT (D) and annexin V (E) and cleaved caspase-3 (F) expression in VAT-resident macrophages were assessed on day 7 after MI in lean Tlr4+/+ and Tlr4−/− mice. n = 4 to 5 per group. Adiponectin concentrations were quantified using enzyme-linked immunosorbent assay in the serum of lean C57BL/6 mice on day 7 after MI (G) (n = 6 to 8 per group), lean C57BL/6 mice on day 7 after MI after Csf1 supplementation (H) (n = 4 to 5 per group), and lean LysMcre/+ ChR-2fl/fl mice without MI after VAT-resident macrophage depletion with blue light (I) (n = 3 per group). MI was induced in lean Adipoq+/+ and Adipoq−/− mice, and a GTT to assess glucose clearance (J); fasting insulin quantification (K); and body weight measurement (L) were performed 7 days later. n = 5 mice per group. Means ± SEM. *P < 0.05, **P < 0.01, and ***P < 0.001.

