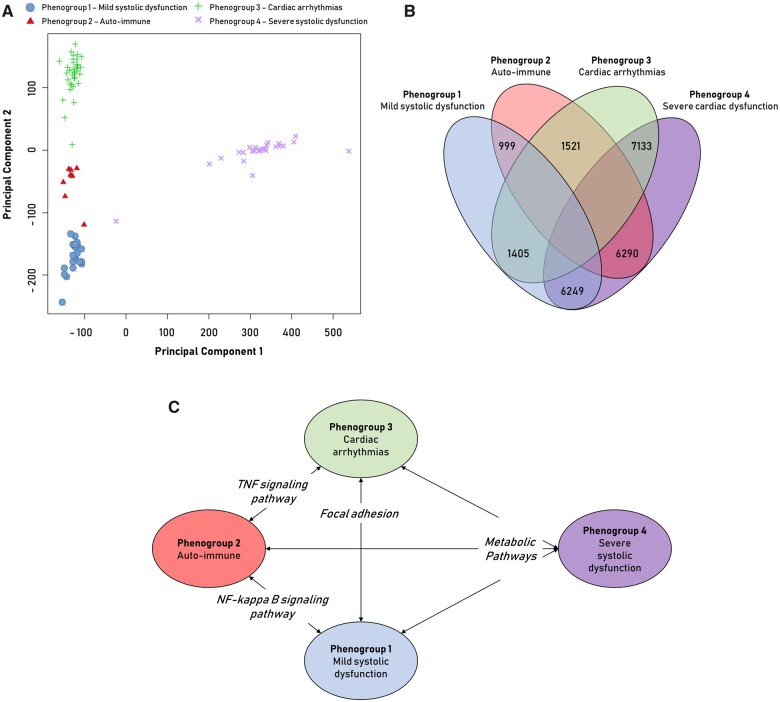
Figure 3.
Analysis of RNA-sequencing data of endomyocardial biopsies from dilated cardiomyopathy patients. Principal component analysis (PCA) of RNA-sequencing data divided on phenogroup (PG). Principal component 1 shows strong division of PG4 and the others (A). Venn diagram of the number of significant differentially expressed genes in the comparison between two corresponding PG (FDR < 0.01 + fold change >1.5) (B). Significantly enriched Kyoto Encyclopaedia of Genes and Genomes pathways (P-value < 0.05) in the comparison between the PG (Table 4) (C).

