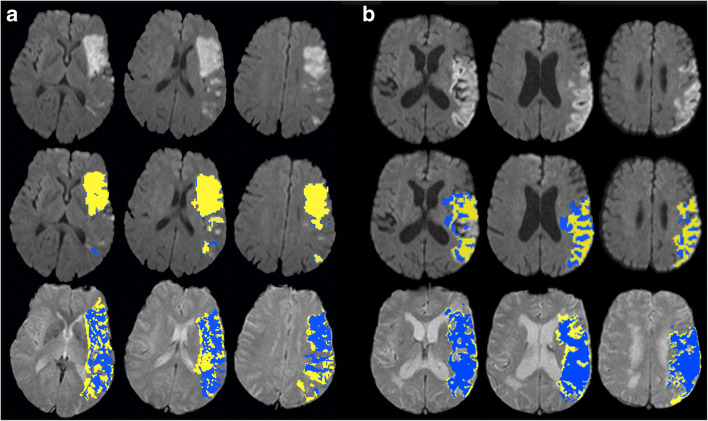
Fig. 6.
Two patients with outlined apparent diffusion coefficient (ADC) lesion volumes (first row) and hypoperfused tissue volumes (second row) evaluated automatically by RAPID® software (blue) and Olea Sphere® software (yellow). Patient a shows a good agreement of ADC lesion volumes with only a small difference of 11 ml (18%). A larger difference of 37 ml (41%) was observed for hypoperfused tissue volume. In patient b, the difference of the calculated ADC volumes of 43 ml (81%) is large. A better agreement with a difference of 27 ml (25%) was observed for the hypoperfused tissue

