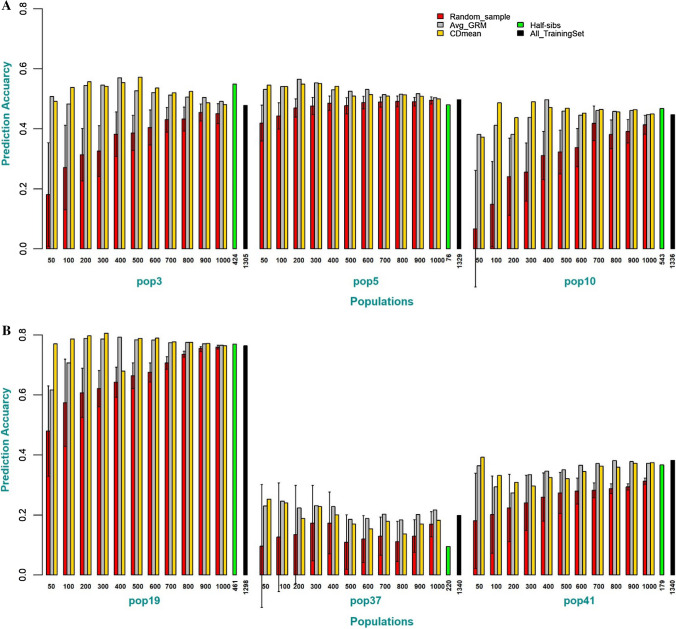
Fig. 3.
a Prediction accuracy of different training set sizes optimized using Avg_GRM and CDmean compared to the random sampling of the training set or the use of all populations (DS2) as a training set for populations 3, 5 and 10. For the random sampling (red color), the error bar represents the degree of variation in prediction accuracy of the 50 repetitions of random selection of individuals as the training set. b Prediction accuracy of different training set sizes optimized using Avg_GRM and CDmean compared to the random sampling of the training set or the use of all populations (DS2) as a training set for populations 19, 37 and 41. For the random sampling (red color), the error bar represents the degree of variation in prediction accuracy of the 50 repetitions of random selection of individuals as the training set

