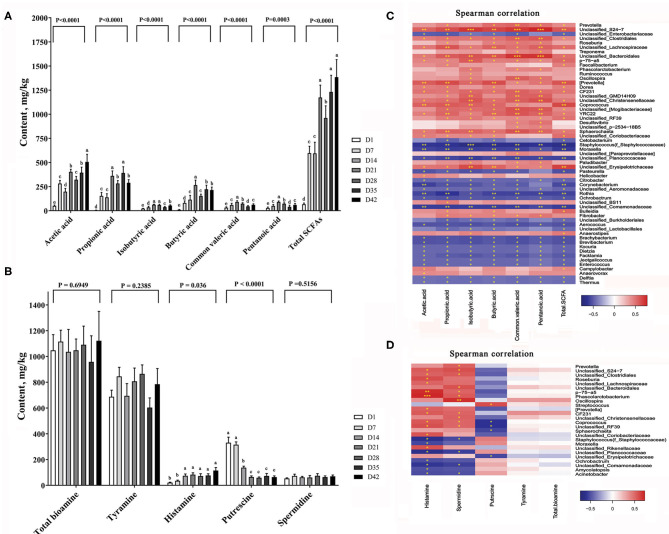
Figure 7.
Changes of major bacterial metabolites. (A) SCFA content in the colon of piglets, (B) Bioamine content in the colon of piglets. The data are presented as the mean ± S.E., n = 5, and different letters on the bars indicate significant differences at P < 0.05 (ANOVA). (C) Spearman's correlations between intestinal microbiota and SCFA; (D) Spearman's correlations between intestinal microbiota and bioamine. The colors range from blue (negative correlations) to red (positive correlations). Significant correlations are noted by ***P < 0.001, **P < 0.01, and *P < 0.05.

