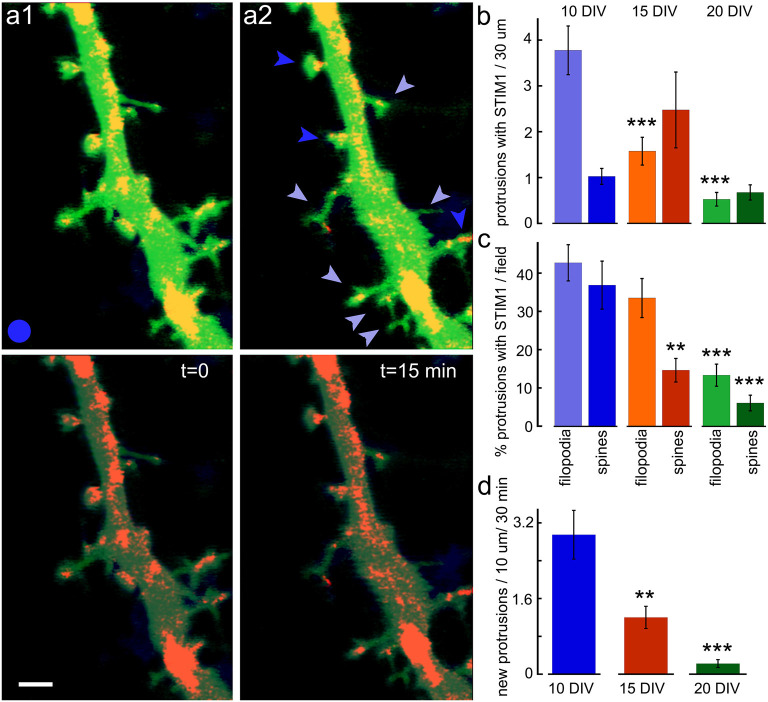
Figure 4.
New protrusions are associated with STIM1. (A1) Puncta are shown at two time-points; t = 0 and (A2) t = 15 min. Top images are EGFP (green, for morphology) and STIM1-mCherry (red) merged. Bottom panels show the same fields with EGFP dimmed. Scale bar = 2 μm. (B) The overall ratio of STIM1-containing protrusions in 10, 15, and 20 DIV is shown in absolute values. The total number of protrusions per standard field (filopodia and spine-like structures) are shown for all three ages (n = 40 fields for each age). (C) The normalized proportion of STIM1-positive protrusions as a percent of the total number of protrusions per field. (D) The appearance of new protrusions, associated with STIM1 puncta for DIV 10, 15, and 20 in the standard field per 30 min is summarized. **Very significant, 0.01 > p > 0.001; ***highly significant, p < 0.001.

