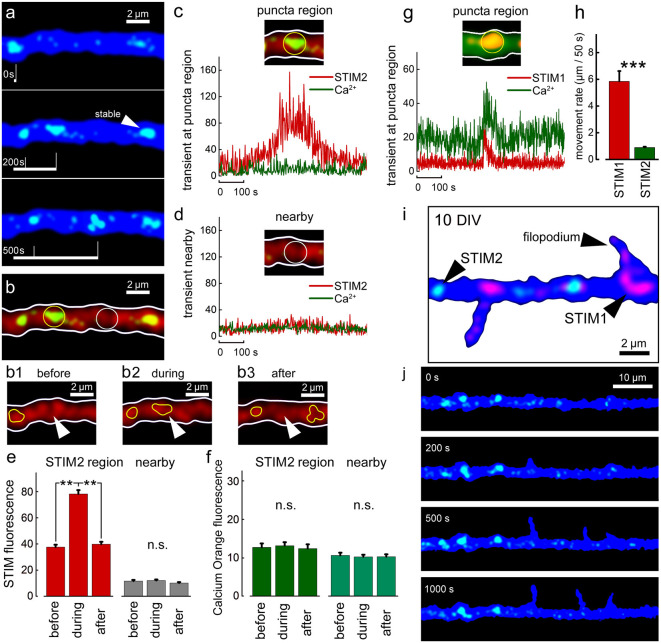
Figure 7.
STIM2-YFP puncta movement in relation to [Ca2+]i transients. (A) Sample illustration of stable and mobile STIM2-YFP (green) puncta over 500 s, DIV 10. Cell morphology marked with EBFP (blue). Overall number of motile/stable puncta per segments of 50 μm: DIV 10: 0.4 ± 0.2/3.3 ± 0.4 (nine cells, n = 14 segments); DIV 15: 0.5 ± 0.4/3.4 ± 0.4 (six cells, n = 13 segments); DIV 20: 0.9 ± 0.3/4.3 ± 0.2 (six cells, n = 10 segments). (B) Same dendritic segment with Calcium Orange (CO) fluorescence (red). Two regions are marked with yellow and white circles: with punctum and nearby regions, respectively. Panels (B1–3) show the region marked with arrowhead before, during, and after the entrance of the STIM2 punctum (yellow contour). Stable punctum contour is shown on the left. (C) Corresponding graph demonstrating the change in STIM2 (red) and CO (green) fluorescence over time inside the marked region. (D) A nearby region without STIM2 and the corresponding traces. (E) Averaged mobile STIM2 fluorescence before, during, and after the entrance into the region of interest (left, red columns) and in the nearby region (gray). All for DIV 10. n = 6 paired region, five cells. (F) CO fluorescence for same times and regions as in (E). (G) Sample STIM1 puncta fluorescence over time inside the marked region for comparison vs. STIM2: a calcium transient can be detected (Fluo-2, green trace). (H) Averaged rate of motility per 50 s, DIV 15, regardless of size puncta, STIM1: 5.9 μm ± 0.8, n = 27 representative motile puncta from nine cells; STIM2: 0.9 μm ± 0.1, n = 20 representative motile puncta from eight cells. Note that the motility of STIM2 puncta is much lower that of STIM1, difference highly significant, t = 6.39, p < 0.001. (I) Example of a cell at 10 DIV, co-transfected with STIM1 (red) and STIM2 (green). EBFP for cell morphology (blue). (J) Example of filopodia spontaneous outgrowth at DIV 10, over 1,000 s in STIM2 transfected neuron (green). Note the lack of association of the growth with STIM2. **Very significant, 0.01 > p > 0.001; ***highly significant, p < 0.001; n.s., not significant, p ≥ 0.05.

