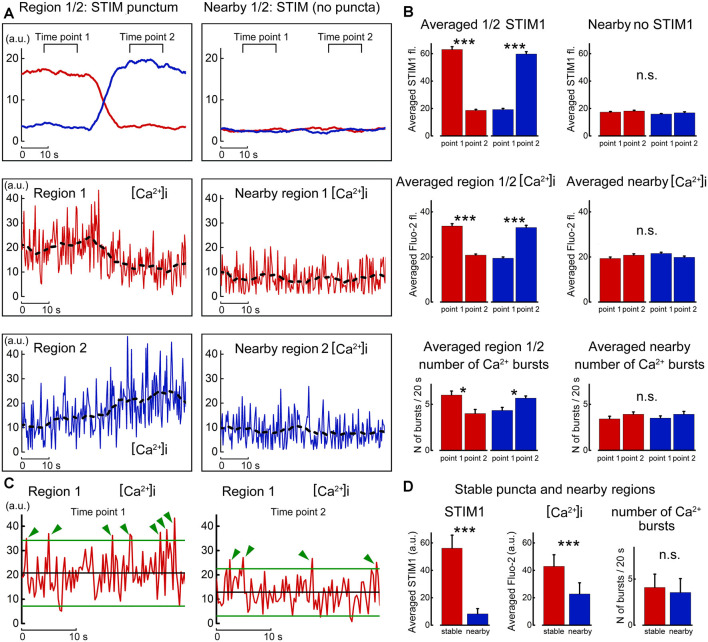
Figure 8.
Motility of STIM1 punctum is correlated with local calcium sparks. (A) Movement of a STIM1 punctum from region 1 to region 2 (top left, as in Figure 6) and by comparison to an adjacent region, where no STIM1 puncta are detected (top right). Below, calcium fluctuations in the corresponding region 1 and nearby quiet region, and calcium fluctuation in region 2 to where the STIM1 punctum moved. (B) Averaged fluorescence of STIM1 and corresponding Fluo2 fluorescence in the two positions where STIM1 was detected. (C) Expanded traces taken from region#1 in the presence (left) and absence (right) of STIM1 punctum. Two lines are drawn at 2 SD from the mean, and deviations of the calcium fluorescence line above the regions are marked with green arrows. (D) Average fluorescence of STIM1 and Ca2+ level in regions of stable puncta and nearby region in 10 s; the number of Ca2+ bursts in 20 s, n = 9 cells, DIV 15. *Significant, 0.05 > p > 0.01; ***highly significant, p < 0.001; n.s., not significant, p ≥ 0.05.

