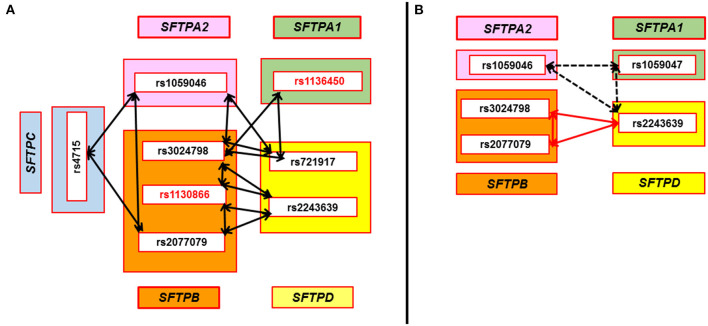
Figure 2.
SNP-SNP interactions associated with HP compared to avian antigen exposed and non-exposed controls in the three-SNP model. Double head arrows represent common SNP-SNP interactions associated with HP and found to be significant in two sets of comparisons (HP vs. avian antigen exposed controls and HP vs. non-antigen exposed controls) in the three-SNP model. The SNPs of surfactant protein genes SFTPA1, SFTPA2, SFTPB, SFTPC, and SFTPD encoding SP-A1, SP-A2, SP-B, SP-C, and SP-D, respectively, are depicted within the green, pink, orange, blue, and yellow rectangles, respectively. (A) shows five significant interactions that were associated with lower risk of HP compared to antigen exposed and non-exposed controls. All these interactions were among SNPs of both hydrophobic and hydrophilic SPs and involve at least one SNP of SFTPB (n = 5) that interacts with SNPs of SFTPD (n = 4), SFTPA1 (n = 1), SFTPA2 (n = 2), and SFTPC (n = 1), p = 0.002–0.04, OR = 0.4–0.5 (0.3–0.8). Two cases of the three-SNP model involved two SFTPB SNPs interacting (rs3024798 and rs1130866, or rs1130866 and rs2077079) with the same SFTPD SNP (rs2243639). SNPs associated with lower risk of HP compared to non-exposed controls in the single-SNP model are shown in red bold font (rs1130866 of SFTPB and rs1136450 of SFTPA1). (B) shows two significant interactions associated with increased risk of HP compared to antigen exposed controls. One of the interactions, shown by the black dash double head arrow, is among SNPs of the hydrophilic SPs alone and was associated with increased risk of HP compared to antigen exposed and non-exposed controls, p = 0.009–0.05, OR = 3.5–5.4 (1.7–20.1). However, the other interaction, shown by red double head arrow among SNPs of the SFTPB and SFTPD, was associated with increased risk of HP compared to antigen exposed controls [p = 0.008, OR = 3.1 (1.6–6.4)]. Of interest, the same interaction was associated with lower risk of HP compared to non-exposed controls [p = 0.002, OR = 0.4 (0.3–0.7)].

