FIGURE 2.
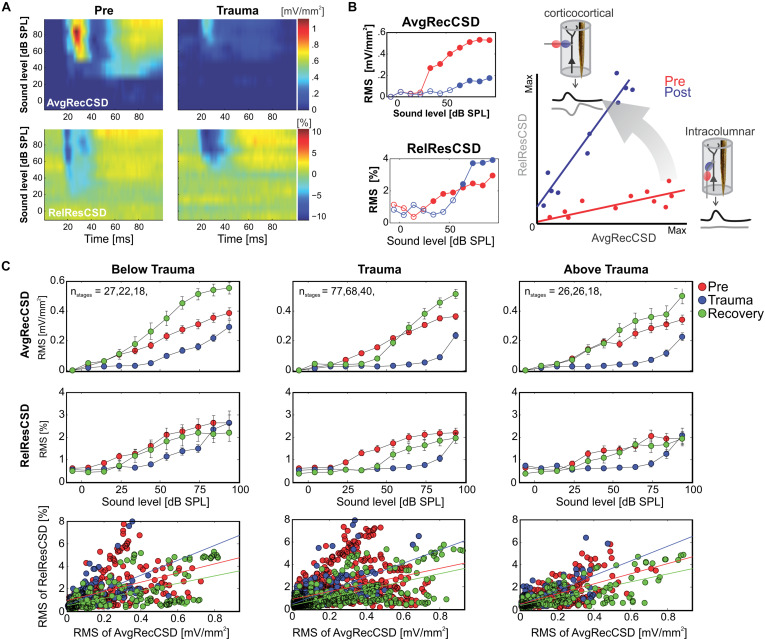
(A) Representative example of AvgRecCSD (top panels) and RelResCSD (bottom panels) evoked by 1 kHz stimulation prior to (left) and after trauma induction (right) at a cortical site with a BF of 5.6 kHz. (B) For further quantitative analysis root-mean-square values during 100 ms stimulus presentation were calculated for AvgRecCSD and RelResCSD. Prior to trauma induction (red circles) the threshold of activation was 34 dB SPL (filled circles) and increased to 64 dB SPL after trauma. Small columnar insets schematize the effects of the geometrical arrangement of projection systems into a cortical column on the AvgRecCSD, a measure of the overall activity in a cortical column, and the RelResCSD, a measure of the unbalanced activity by sinks and sources, distributed across the cylinder of integration reconstructed around the recording site. While AvgRecCSD values generally decreased after trauma, RelResCSD values even increased from around 2 to 4%. Note, that both before and after trauma induction AvgRecCSD and RelResCSD were highly correlated (p < 2 × 10− 5). In the schematic depiction of the comparison between both parameters (right), red and blue lines indicate linear regression lines before and after trauma, respectively. Comparisons of their slopes and offsets allow us to investigate the effect of sound-trauma on local and corticocortical synaptic circuits. (C) Across all experiments and independent of the frequency of pure tone stimulation relative to the trauma frequency AvgRecCSD (top panels) values increased with increasing sound levels (data are shown as mean ± SEM). As for the individual example in panels (A,B), RelResCSD (middle panels) values also increased with increasing level. Expectedly, after trauma a reduction of AvgRecCSD values was observed. Interestingly, several weeks after trauma (green circles – Recovery), higher mean AvgRecCSD values than before trauma were observed. These changes seem not to be counterbalanced by relative increases in RelResCSD values. A regression analysis on the relationship between AvgRecCSD and RelResCSD revealed significant correlations in all cases analyzed (p < 10− 13). For further quantitative analysis see main text.

