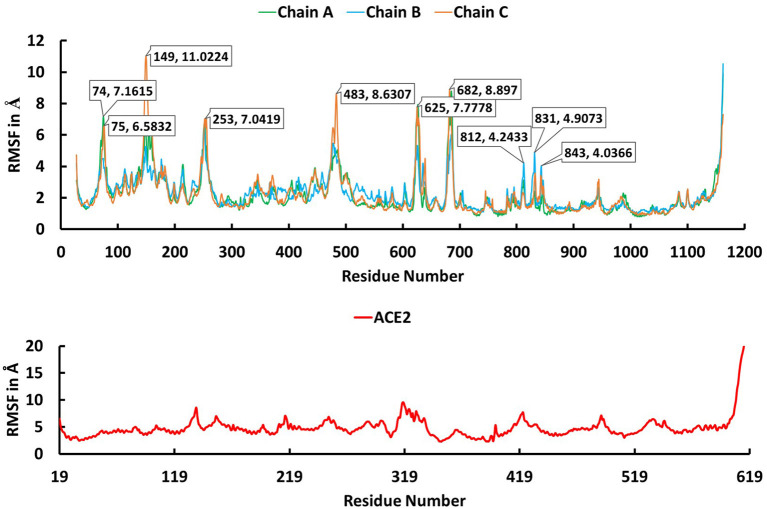
Figure 4.
The root mean square fluctuation (RMSF) plot for Cα atoms in chain A (green), B (cyan), and C (brown) of the trimeric form of Severe Acute Respiratory Syndrome Coronavirus-2 spike protein and ACE2 (red) during the 100 ns molecular dynamics simulations. The X axis indicates residue number and Y axis represents RMSF value in Å.

