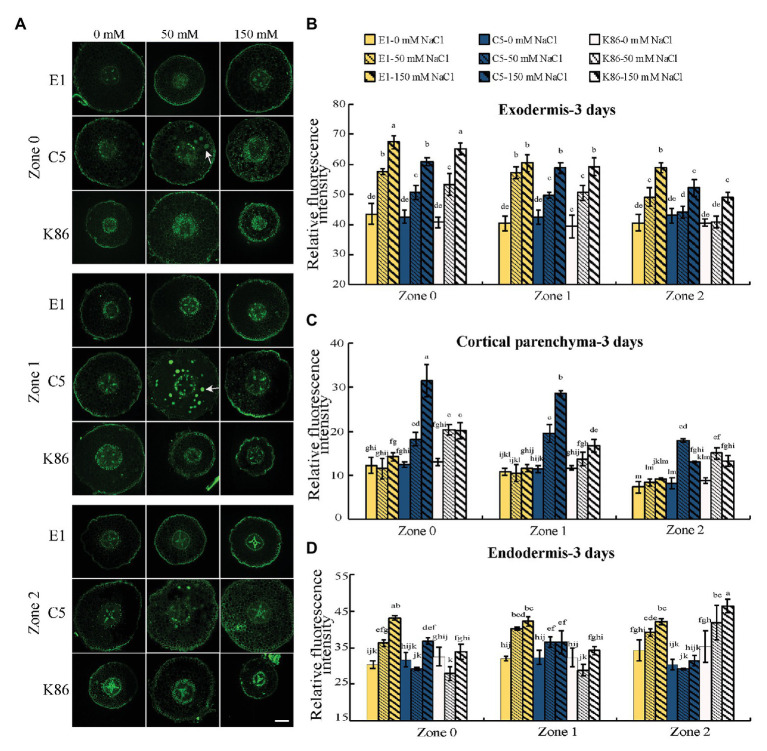
Figure 3.
E1 shows lower sodium accumulation under salinity stress compared with C5 and K86. (A) Representative images of CoroNa Green staining in different root developmental zones of E1, C5, and K86 treated with 0, 50, and 150 mM NaCl for 3 days. White arrows highlight sodium vacuolar localization in C5. Scale bars, 100 μm. (B) Quantification of sodium signal in the exodermis, (C) cortical parenchyma, and (D) endodermis shows lower fluorescent signal, etc. Values are means ± SE (n = 15). Different lowercase letters indicate significant differences at p < 0.05, three-way ANOVA.

