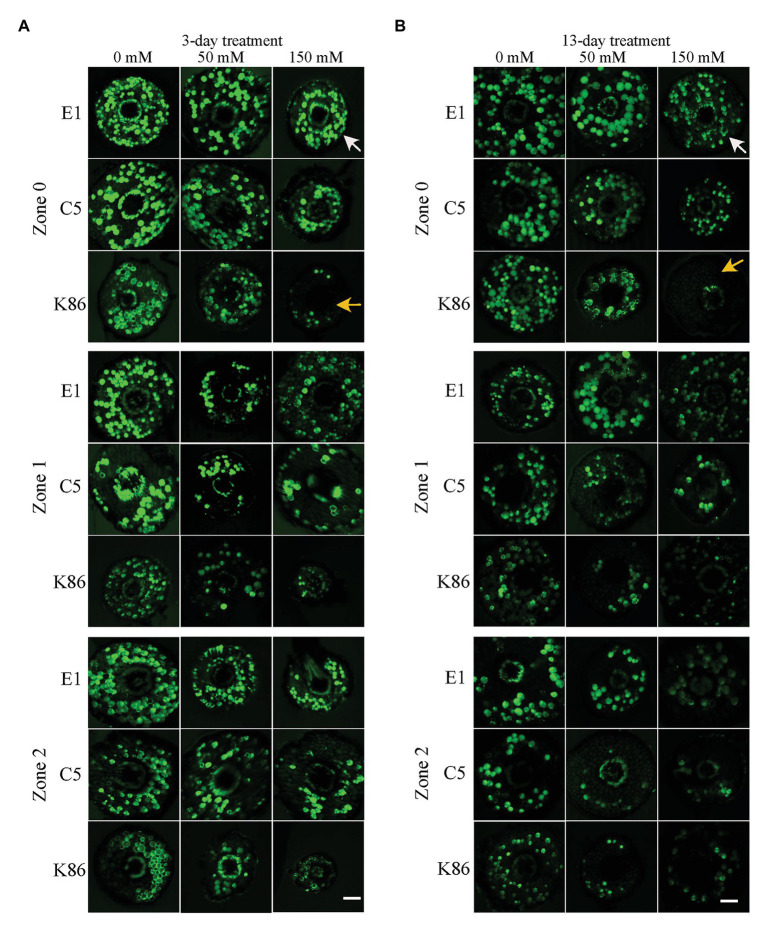
Figure 4.
Cell viability across a root developmental gradient in salt-stressed rootstocks. Cell viability analysis in E1, C5, and K86 treated with 0, 50, and 150 mM NaCl shows decreased viability with increased length of treatment (A) and (B). Representative images of fluorescein diacetate (FDA) staining in the root of E1, C5, and K86 under a 3-day (A) and a 13-day (B) salt treatment. White arrows highlight live cells in E1. Yellow arrows indicate a reduction in the number of live cells in K86. Scale bar, 100 μm. Representative images of n = 15.

