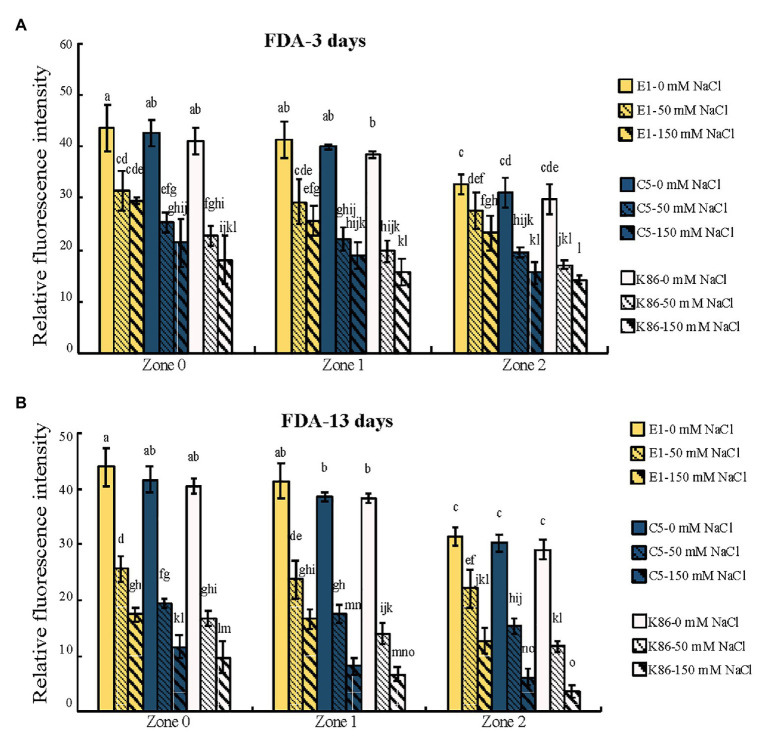
Figure 5.
Quantification of cell viability across the root developmental gradient of E1, C5, and K86. Quantification of cell viability indicates that E1 has the highest number of viable cells under salt treatments. Fluorescence quantification of fluorescein diacetate (FDA) staining in the roots of E1, C5, and K86 treated with 0, 50, and 150 mM NaCl for 3 days (A) and 13 days (B). Analysis shows a reduction in cell viability concomitant with increased salt concentration and duration of treatment. Values are means ± SE (n = 15). Different lowercase letters indicate a significant difference at p < 0.05, three-way ANOVA.

