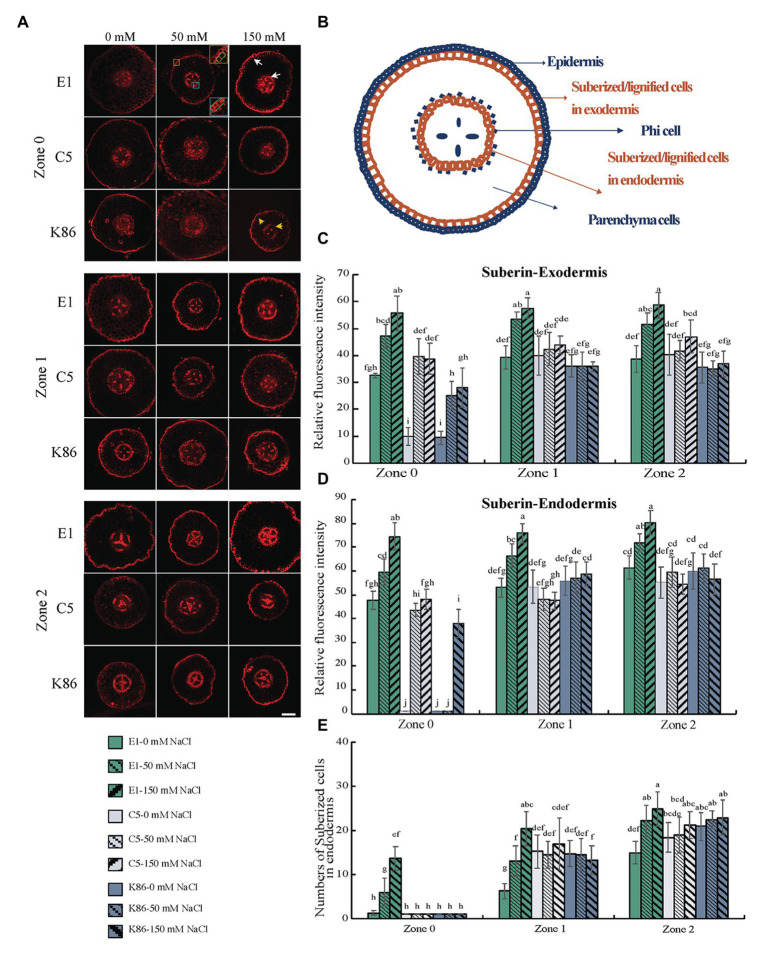
Figure 6.
Suberin deposition across a developmental gradient in almond rootstocks. Suberin deposition across a developmental gradient in E1, C5, and K86 treated with 0, 50, and 150 mM NaCl for 3 days. (A) Representative images of suberin staining in the root of E1, C5, and K86 across different developmental zones. Scale bar, 100 μm. Yellow box highlights the exodermis; cells highlighted by a green box are quantified for fluorescence intensity. Blue box highlights the endodermis; cells highlighted by a green box are quantified for fluorescence intensity. White arrows indicate the suberized cells in exodermis and endodermis in E1. Yellow arrows indicate the reduced number of suberized cells in K86. (B) Representative diagrams of almond root in transverse section indicating the location of apoplastic barriers and phi cells. Quantification of suberin staining in exodermis (C) and endodermis (D) of E1, C5, and K86 indicates higher suberization and increased salinity stress response in E1. (E) Quantification of suberized cell number in endodermis of E1, C5, and K86. Values are means ± SE (n = 15). Lowercase letters indicate a significant difference at p < 0.05, three-way ANOVA.

