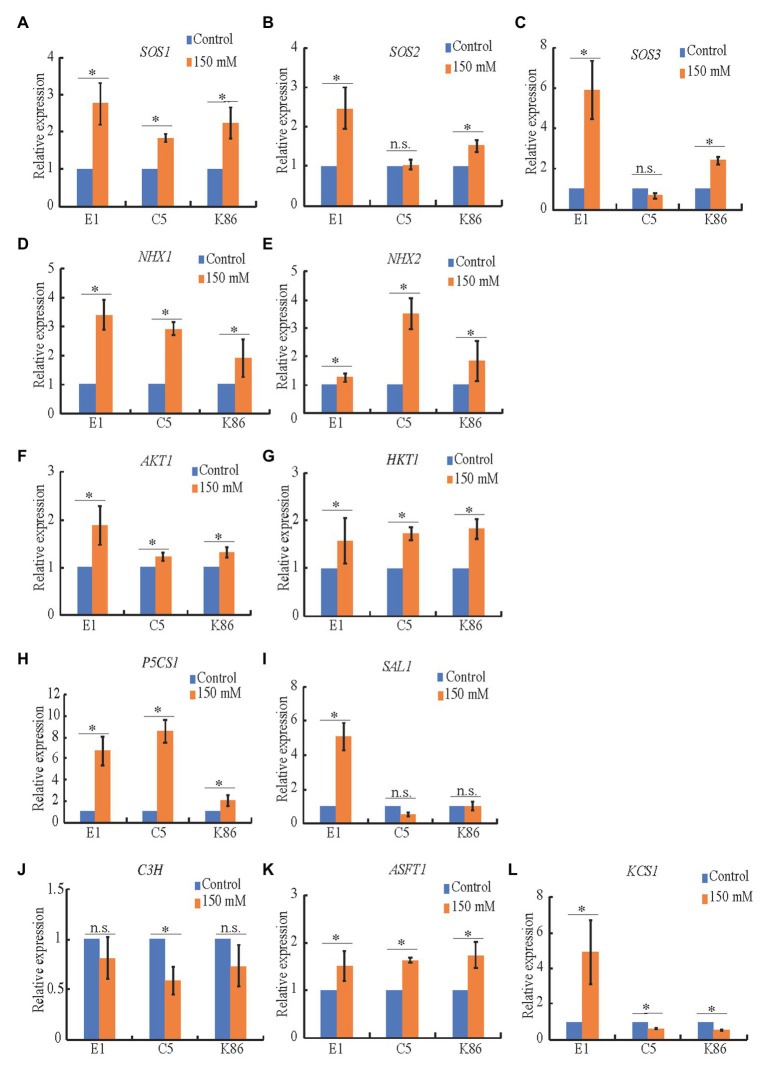
Figure 8.
Expression analysis of candidate genes in salinity stress in almond rootstocks. RT-qPCR analysis of the expression level of candidate salinity stress genes in E1, C5, and K86 under control conditions and 150 mM NaCl treatment for 3 days. (A-C) SOS genes show a significant upregulation in salt-treated samples in E1. (D,E) Candidate genes involved in the sequestration of Na+ in vacuoles. NHX1 is upregulated in all genotypes in response to salinity stress. NHX2 is upregulated threefold in C5 plants. (F,G) Candidate genes involved in Na+ transport are upregulated in response to salinity stress, with AKT1 showing a higher upregulation in E1. (H) Proline biosynthesis is upregulated in response to salinity stress in all three genotypes, with a weaker response in K86. (I) The abiotic stress signaling pathway is highly upregulated in E1, but not C5 or K86. (J-L) Candidate genes involved in suberin biosynthesis show more significant upregulation compared to lignin biosynthesis. KCS1 shows a significant upregulation of expression in E1 compared to downregulation in C5 and K86. Values are means ± SE (n = 12). *p < 0.05.

