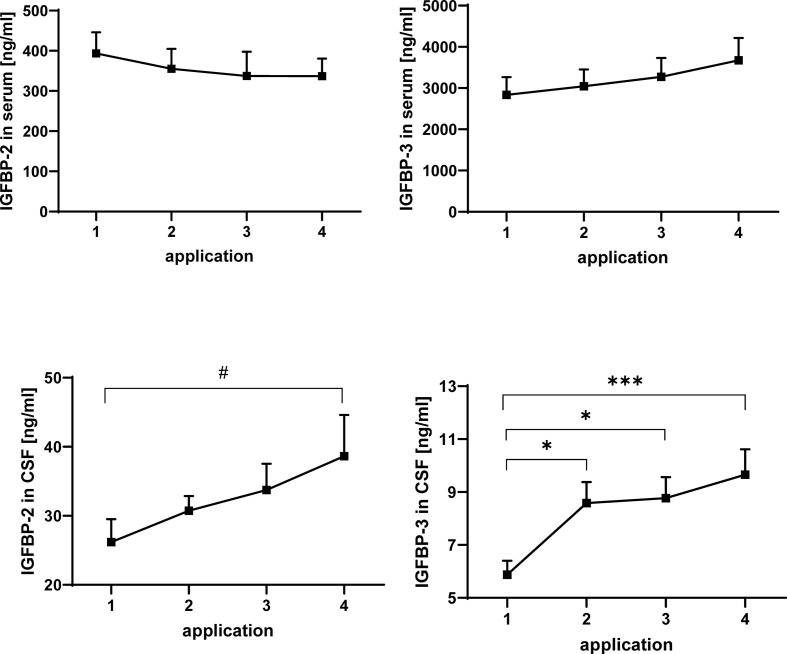
Figure 3.
Concentrations of IGFBP-2 (left panels) and IGFBP-3 (right panels) in serum (upper panels) and CSF (lower panels) in MS patients at the time points of intrathecal TCA injection. The data are based on sample series from 20 treatment cycles (14 cycles in four males and 6 cycles in two females) and are given as means ± SEM (#p < 0.067; *p < 0.05; ***p < 0.001).

