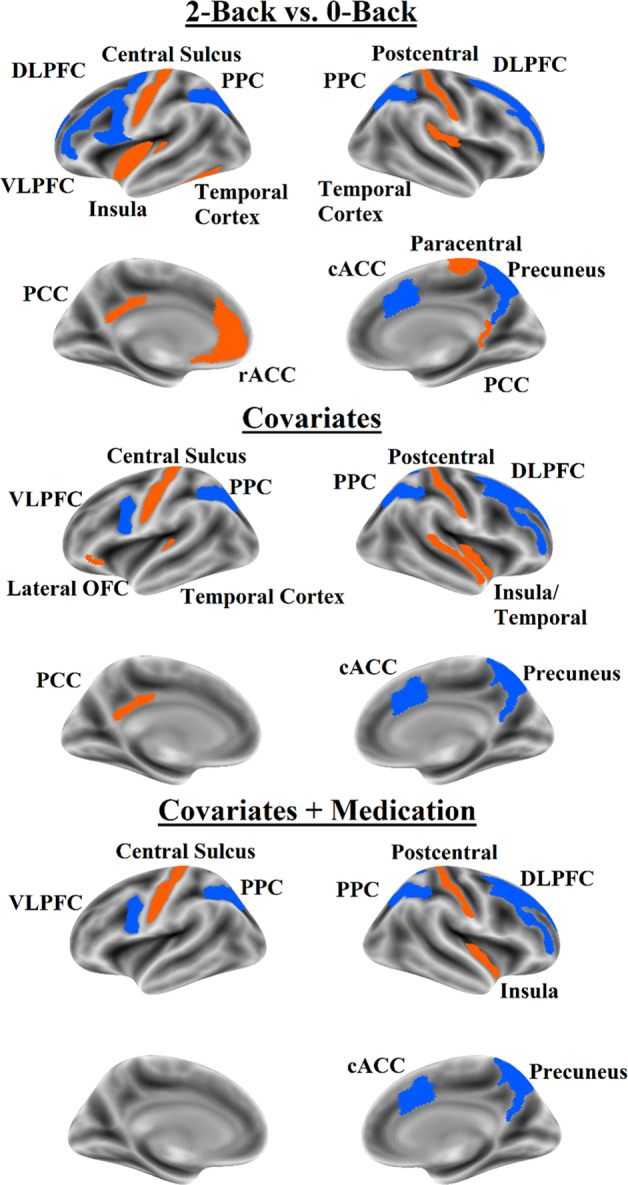
Fig. 2. Brain map for fMRI features that predicted ADHD symptomatology in the elastic net regression and were associated with ADHD symptomatology in univariate mixed effect models.

Orange indicates positive coefficients; blue indicates negative coefficients. Top panel = no covariate analysis, middle panel = analysis with covariates except medication status; bottom panel = all covariates including medication status. DLPFC dorsolateral prefrontal cortex, VLPFC ventrolateral prefrontal cortex, cACC caudal anterior cingulate cortex, rACC rostral anterior cingulate cortex, OFC orbitofrontal cortex, PPC posterior parietal cortex, PCC posterior cingulate cortex.
