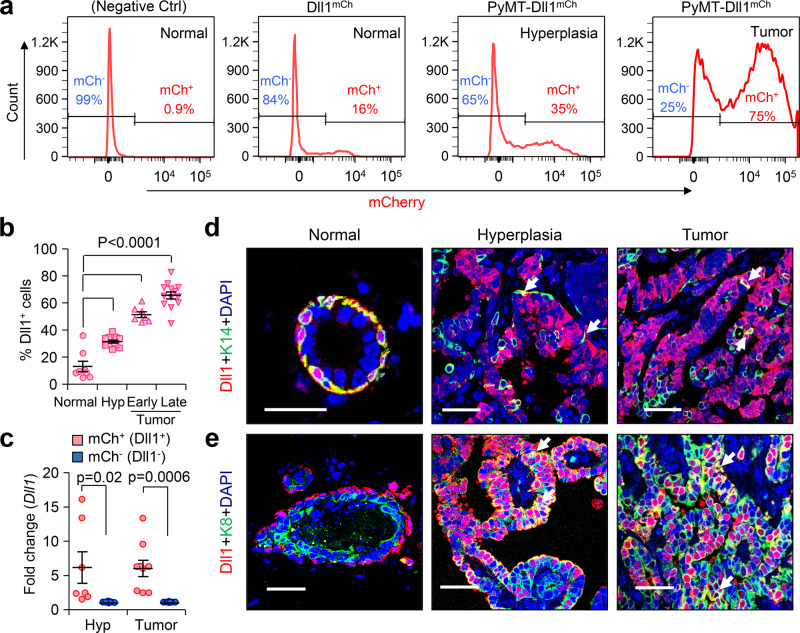
Fig. 2. Number of Dll1+ luminal cells increases during PyMT tumor development.
a, b Flow cytometry profile of Lin- tumor cells show increasing Dll1+ cells (mCherry expression) in PyMT-Dll1mCh tumors between normal to tumor stage, which are quantified in b. b n = 8 normal mammary gland, n = 12 hyperplatic mammary glands, n = 7 early tumors, and n = 13 late tumors. c qPCR analysis shows high Dll1 mRNA expression in mCherry+ vs. mCherry- tumor cells at hyperplasia and tumor stages (n = 7 hyperplastic mammary glands and n = 9 tumors). We enzymatically digested PyMT-Dll1mCh normal mammary glands, hyperplastic mammary glands, and tumors to sort lineage-negative (CD45-CD31-TER119-) Dll1+ or Dll1− cells based on mCherry expression to quantify Dll1 mRNA levels. Dll1− (mCh−) fold considered 1 to calculate Dll1+ (mCh+) fold changes. d–e Representative immunofluorescence (IF) images of the normal mammary gland, hyperplasia, and tumor of PyMT-Dll1mCh mice show cellular distribution of Dll1 during tumor development. mCherry antibody was used to detect Dll1mCh+ cells. d White arrows indicate positive cells for a basal marker K14 and Dll1. e White arrows indicate the colocalization of Dll1 and K8 (n = 3 tumors per group). Please see more representative images in the supplementary figure 11. b, c P values were calculated using one-way ANOVA with Tukey’s multiple-comparisons post-hoc test (b) and two-way ANOVA with Bonferroni post-test adjustment c. IF staining was done in three independent experiments using tumors from six independent experiments d, e. b, c Data are presented as the mean ± SEM. Scale bars, 40 µm (d, e). Source data are provided as a source data file.

